All blogs
.avif "Cypress: A Guide to API Testing")
Cypress: A Guide to API Testing
What is API Testing?
API, which stands for Application Programming Interface, serves as a means for communication between two distinct software components.
During the development phase of a product, the absence or incomplete state of the user interface (UI) poses a challenge in validating the front-end functionalities. However, API testing provides a solution by enabling the validation of responses expected in the front end as the product takes shape.
This approach proves invaluable in ensuring the reliability and correctness of the software, even before the UI elements are fully implemented.
API supports following HTTP requests - POST, GET, PUT, PATCH and DELETE.
What is Cypress Testing?
Cypress is a JavaScript-based end-to-end testing framework designed for modern web applications. It is specifically built to address the challenges of testing web applications in real-world scenarios.
Cypress is commonly used for conducting functional testing, integration testing, and end-to-end testing of web applications.
Setup Cypress Environment
Refer our article Cypress - Automation tool for modern web for Cypress setup.
Describe and IT Block in Cypress
In Cypress, an "IT block" refers to an individual test case or a test scenario written using the “it” function.
describe is used to group related it blocks and provides a way to organize your tests.
Syntax for describe block:
describe("Testname", ()=>{ })
Inside the describe block, there are it blocks, each representing a different test scenario.
Syntax for it block:
it("Testcase_title", () =>{ })
Each it block contains a set of Cypress test commands that define the steps to be taken during the test. Following is the example

cy.request
Syntax: cy.request(method,URL,body)
In the above command, method and body are optional but the URL is mandatory.
- method : This is a required property that specifies the HTTP method you want to use for the request. It can take values like 'GET', 'POST', 'PUT', 'DELETE', etc. By default, Cypress makes this request as GET.
- URL : The URL argument specifies the URL to which the HTTP request will be sent.
- body : The body argument specifies the data that you want to include in the request body. This is relevant for HTTP methods like POST or PUT, where you often need to send data to the server.
Syntax with two arguments:

Syntax with more than two arguments:

Cypress: A Guide to Making HTTP Requests
GET Request:
Sending GET requests with cy.request command. We will make a GET request to the URL .
Syntax for simple GET Request:

Here, .its('status').should('equal', 200); describes the assertion in Cypress which states that when the request gets successfully passed it should give response 200 and when we receive the response 200 that means our request is successfully passed.

POST Request:
POST request is used to create data on the server. Here in POST Request we require three arguments: method, URL and body. method to state the POST method, URL - endpoint where to send request, body is used for the data you want to send to the server.
Syntax for POST Request:

Here, we are sending userId, title and body data to the server. And when we receive the response 201 that means our request is successfully passed.

PUT Request:
PUT request is used to update the data on the server. Here in PUT Request we require three arguments: method, URL and body. method to state the PUT method, URL - endpoint where to send request, body is used for the data you want to update on the server.
Syntax for the PUT Request:

Here, we are updating the userId, title, body and id data on the server. And when we receive the response 200 that means our request is successfully passed.

DELETE Request:
DELETE request is used to delete the data on the server. Here in PUT Request we require two arguments: method and URL. method to state the DELETE method, URL - endpoint where to send request.
Syntax for DELETE Request:


Here, we delete the data on the server. And when we receive the response 200 that means our request is successfully passed.

Dynamic execution of Post calls in Cypress
Previously we have seen how we can make HTTP post requests with static data. Now lets understand how we can make HTTP Post requests with dynamic data. Cypress provides various functions and with the help of them we will create dynamic data.
Syntax for Dynamic POST Request

In above example:
- We create three variables tourist_name, tourist_email, tourist_location to store the data
- Then we use Math.random() function - This function returns a floating-point, pseudo-random number in the range [0, 1). It generates a random decimal number.
- Then we use, toString() function - The toString method is used to convert the random number generated by Math.random() into a string. The 5 inside the parentheses specifies that the number should be represented in base-5 (quinary) when converted to a string.
- Then we use, substring() function - This method is then applied to the string obtained from toString(5). It takes a substring starting from the 3rd character (index 2) to the end of the string. This is done to remove the decimal point and the integer part of the number, leaving only the fractional part.
Now, assertion will play a role by comparing the values by checking if the 'tourist_name' property in the response body is equal to the 'tourist_name' in the request body, same for ‘tourist_email’ and ‘tourist_location’. When we receive the response 201 that means our request is successfully passed.

How to run the tests?
There are different ways to run the test:
- Through terminal
- Through Cypress dashboard
Through terminal
Steps to execute the test through terminal:
- Go to terminal of VScode/Command Prompt
- Enter the following command:
npx cypress run --spec cypress/e2e/APITesting/filename.cy.js
Through Cypress dashboard
Steps to execute the test through Cypress dashboard:
- Go to terminal of VScode/Command Prompt
- Enter the following command:
npx cypress open (This will open the cypress application)
- Select E2E Testing > Select the Browser (Chrome, Firefox, Electron)
- Select the spec file you want to run to execute your test cases
Conclusion
Cypress API Testing is leveraging the capabilities of the Cypress testing framework to assess and validate the functionality and behavior of APIs (Application Programming Interfaces). Also, it facilitates seamless integration between front-end and API tests. So make use of Cypress for API Testing and improve your testing process.
Happy Testing :)

Headway : Integration with CI (Jenkins)
What is Continuous Integration Testing?
Continuous Integration Testing (CI) is an essential practice in automated testing that focuses on frequent integration and testing of code changes. It brings numerous benefits to the development and testing process, including early bug detection, faster feedback loops, and improved code quality. Integrating Headway with popular CI tools like Jenkins allows for seamless automation of the CI process.
In this blog post, we will walk through the process of integrating Headway with Jenkins for seamless Continuous Integration and Deployment (CI/CD). We'll cover the prerequisites, configuration steps, and execution of a Jenkins job for running a test suite. By the end, you'll have a clear understanding of how to set up and execute CI/CD workflows using Jenkins and Headway.
Prerequisites
Before getting started, ensure that you have the following prerequisites installed on your system:
- Jenkins: Install Jenkins from the official website link.
- Java: Install Java by following the instructions provided here.
- Maven: Install Maven by referring to the official installation guide here.
- Git: Install Git using the official download page here.
Install Plugins in Jenkins
- Open your Jenkins portal and navigate to "Manage Jenkins" >"Manage Plugins".
- Under the "Plugin Manager", click on the "Available" tab
- Search for "Git plugin" and check if it is already installed.
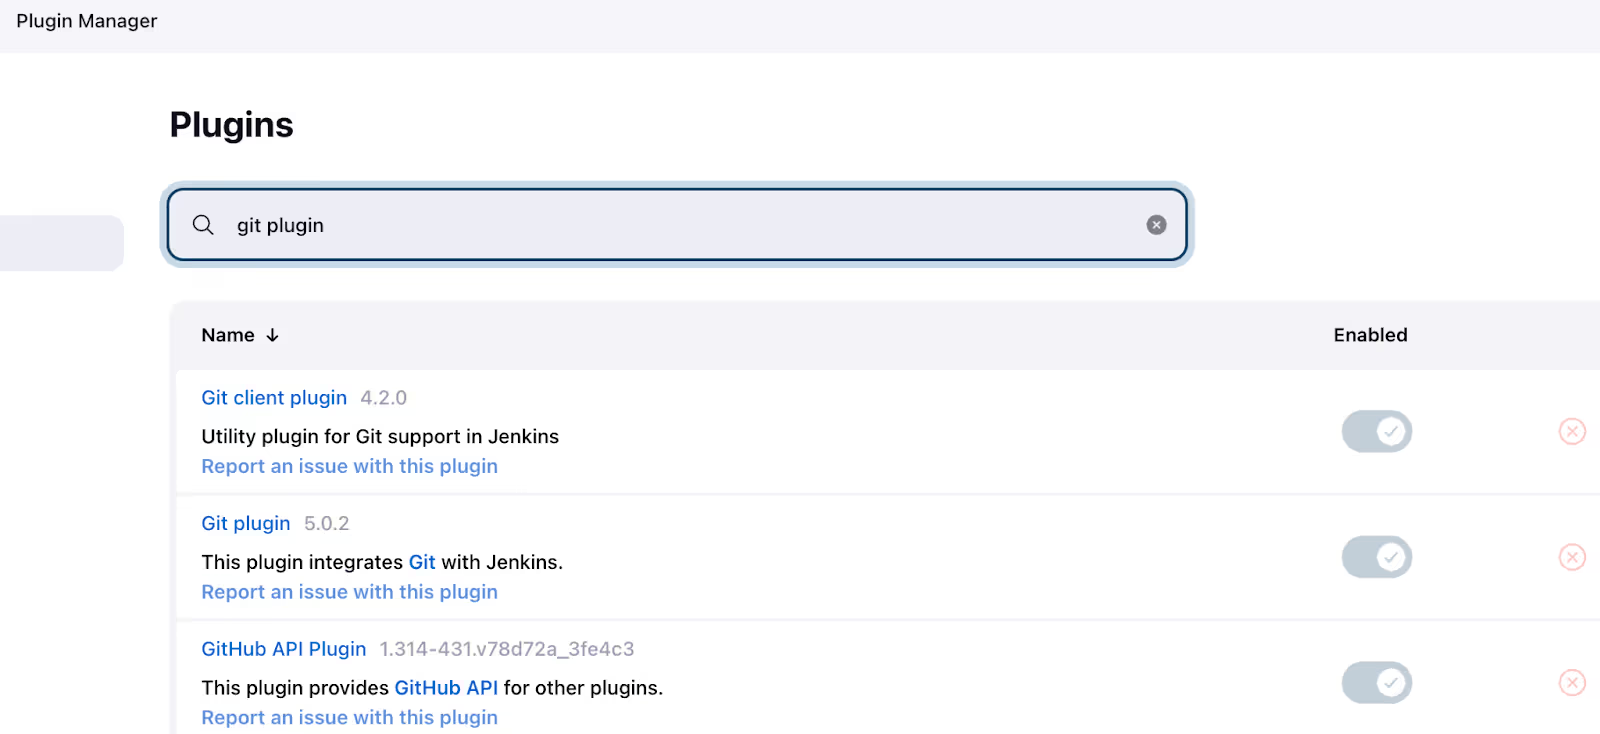
- Search for below plugins and install them:some text
- Maven Integration
- TestNG Results
- HTML Publisher

- After the restart of Jenkins, the Maven Jenkins plugin will be installed successfully and ready for configuration.
Configuring Global Paths in Jenkins
- Open your Jenkins portal and navigate to "Manage Jenkins" > "Global Tool Configuration."
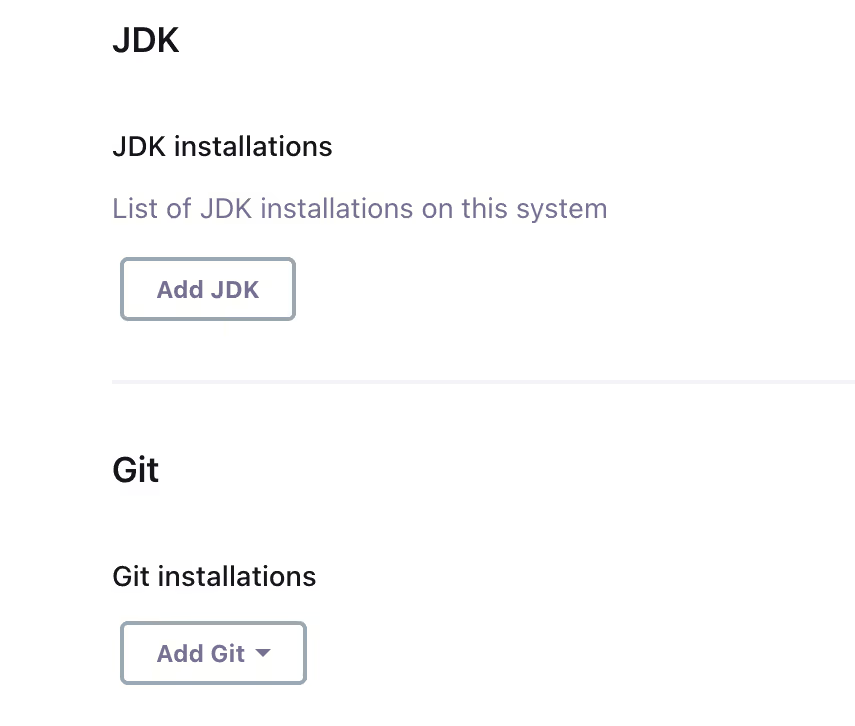
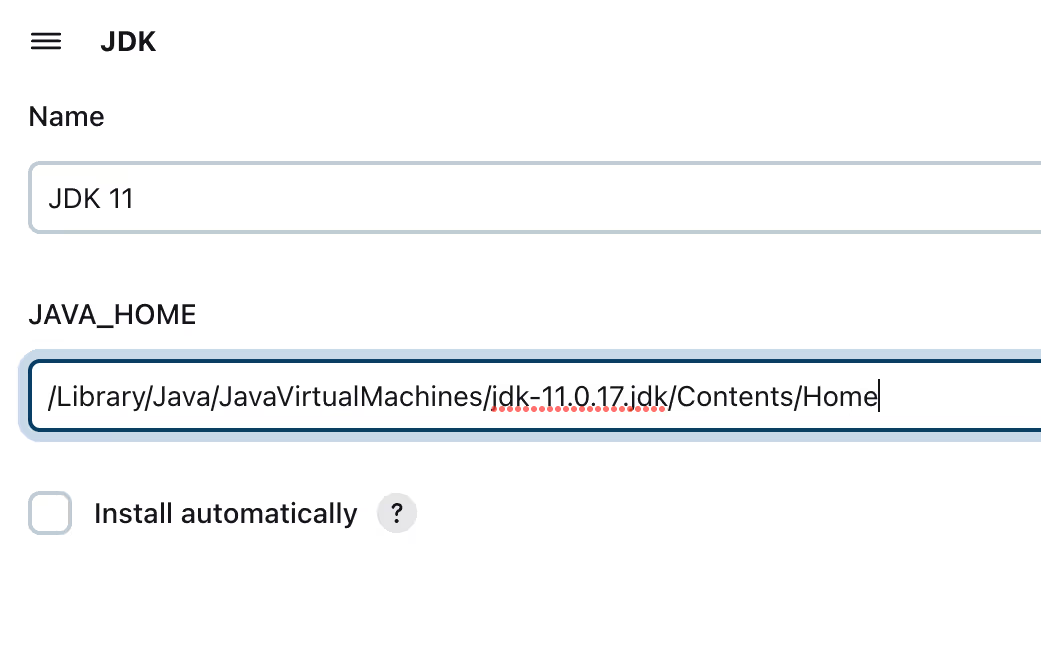
- Add JDK: Provide a name and the JDK installation path.
- Add Git: Specify a name and the Git installation path.

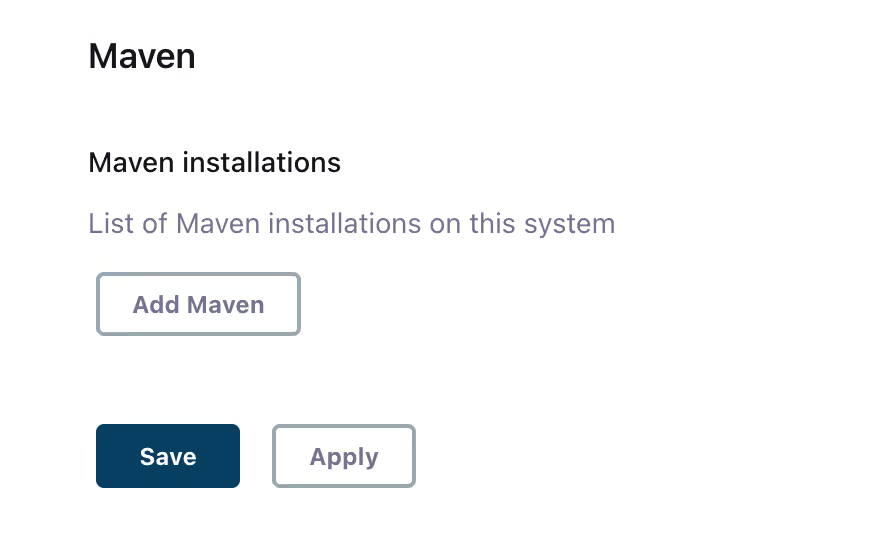
- Add Maven: Enter a name and the Maven installation path.
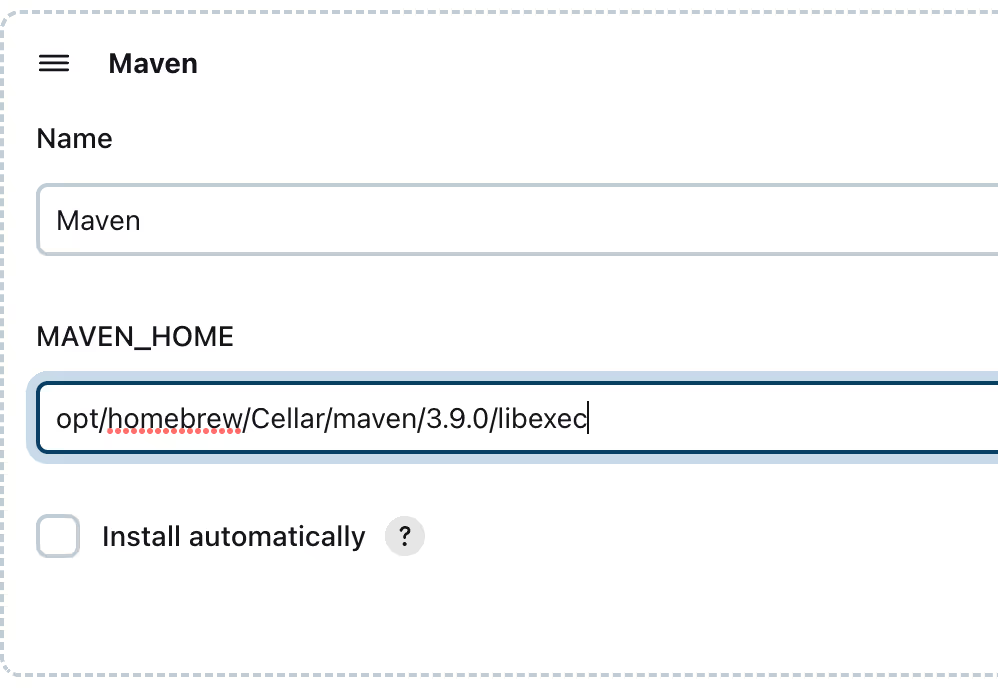
- Click "Apply" and save the configuration.
Creating a Jenkins Job
- Click on "Create a job" in Jenkins.
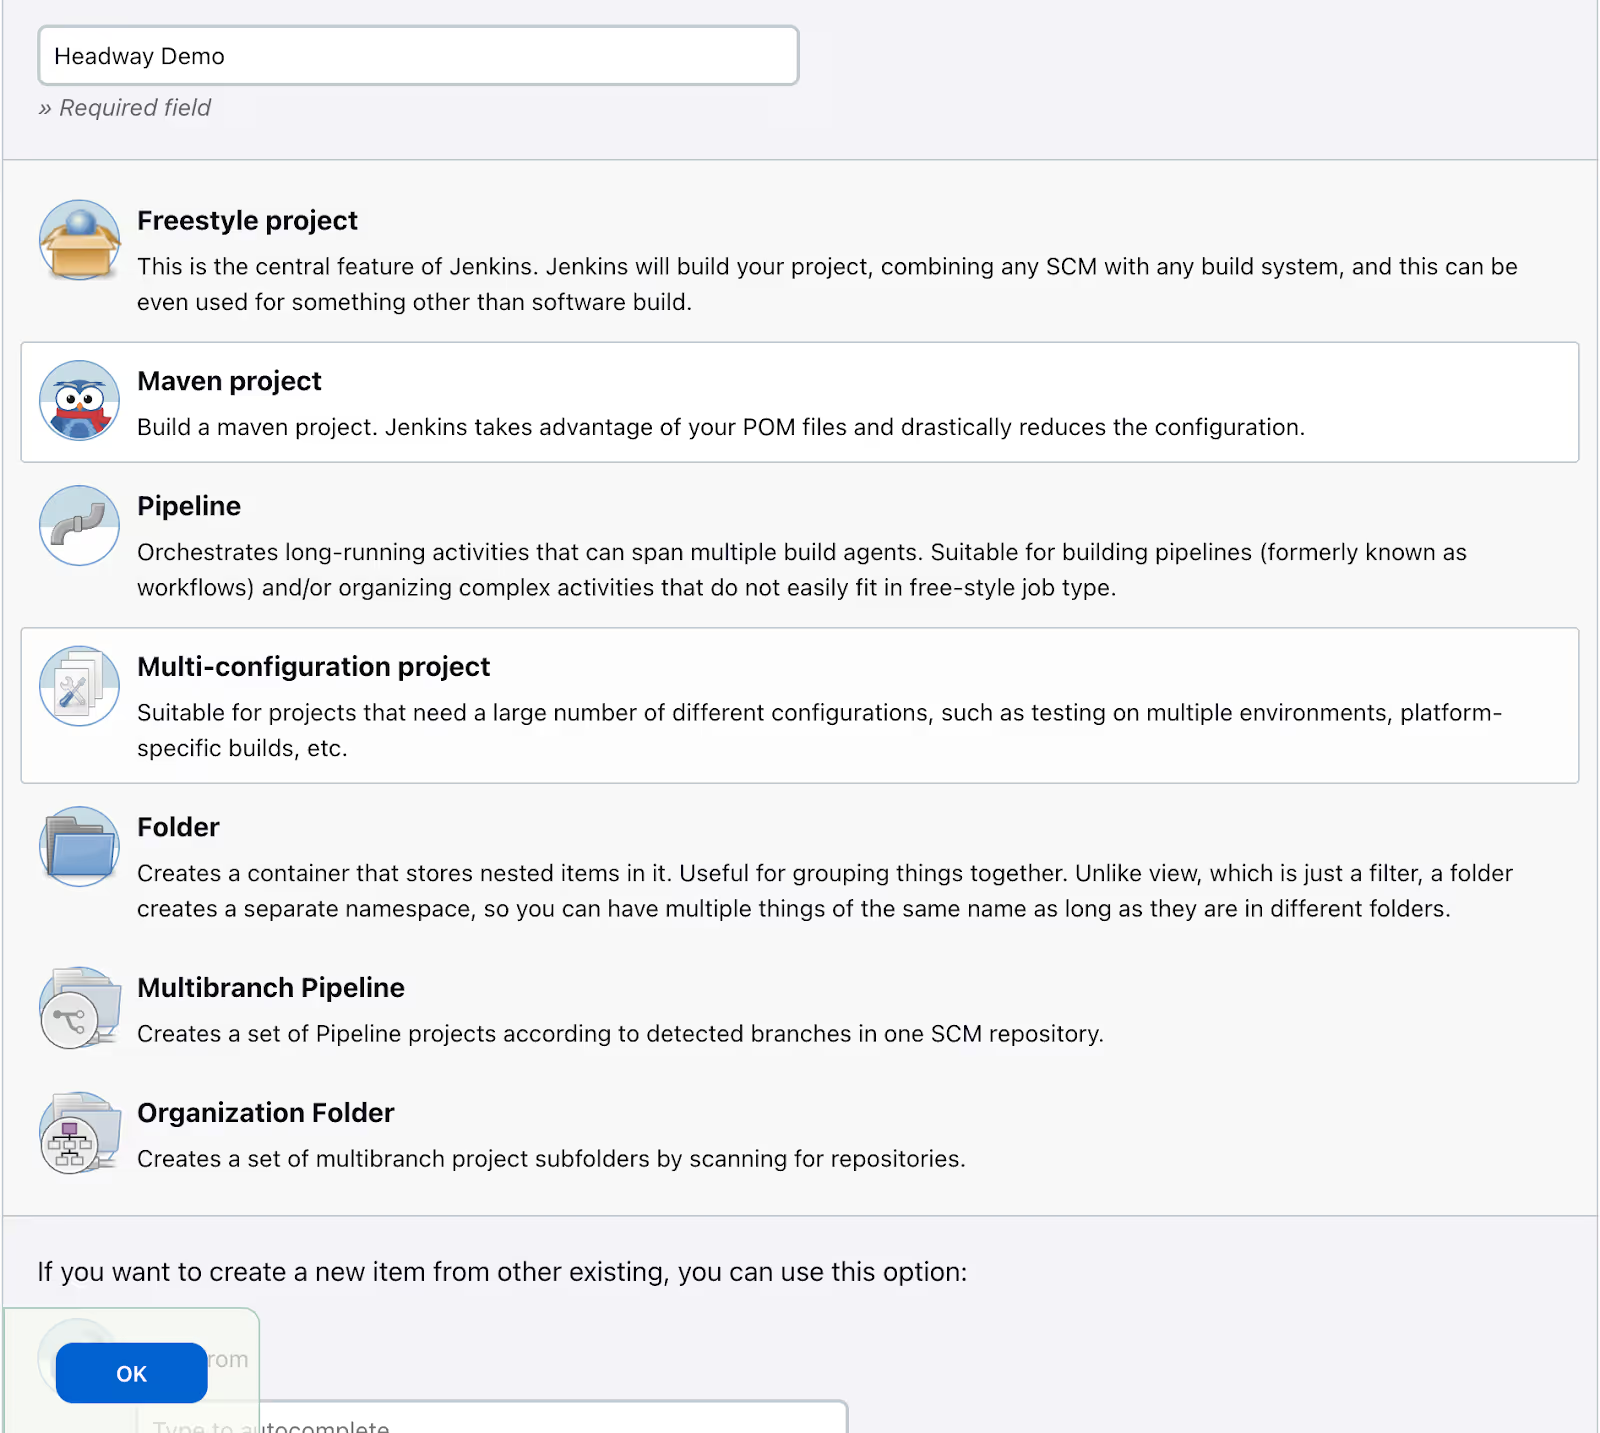
- Enter a name for the job and select the "Maven project" job type.
- Click "OK" to proceed
Configuring a Jenkins Job
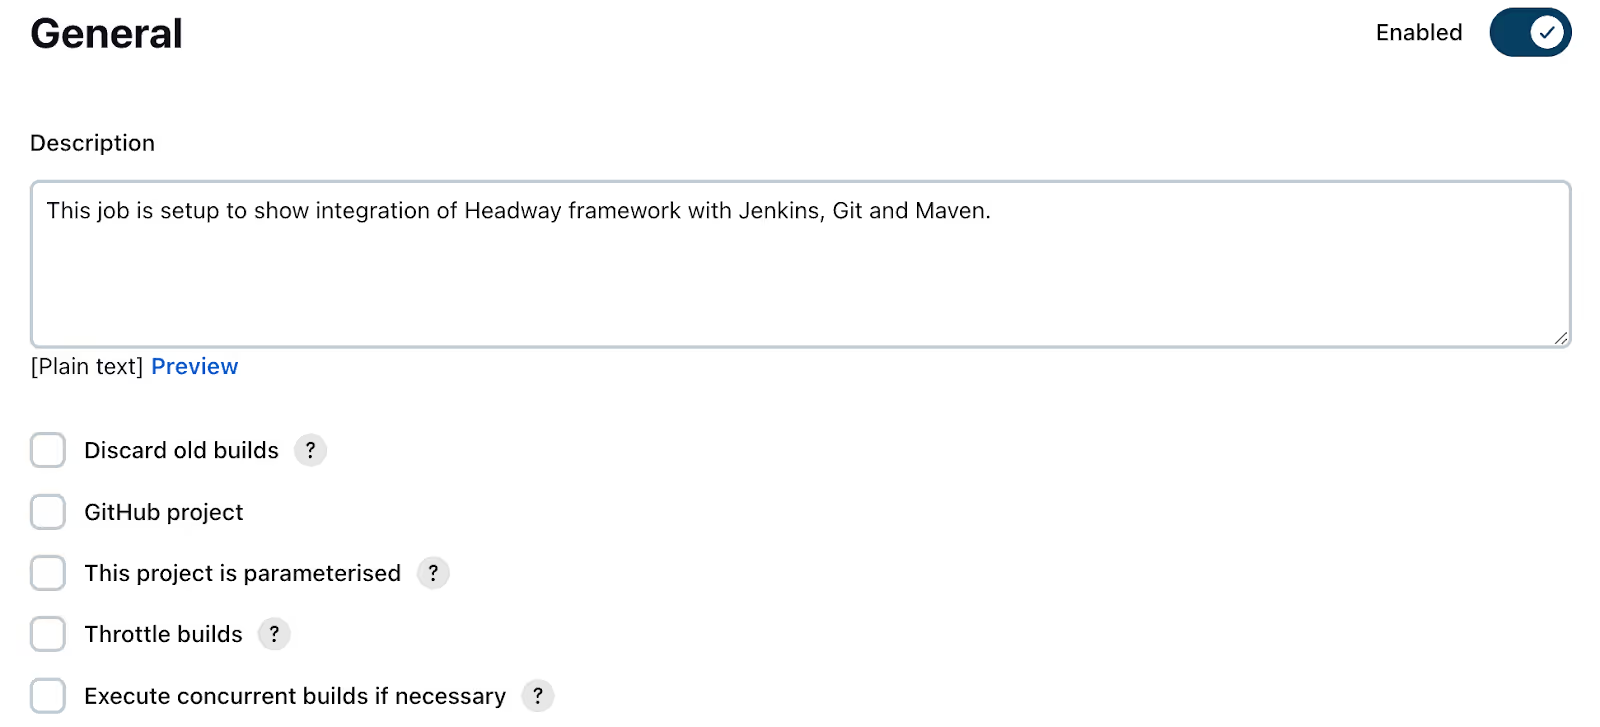
- General: Enter description of the project in the ”Description” field.
- Source Code Management: Paste your Headway project git repository link and specify branch name “master”
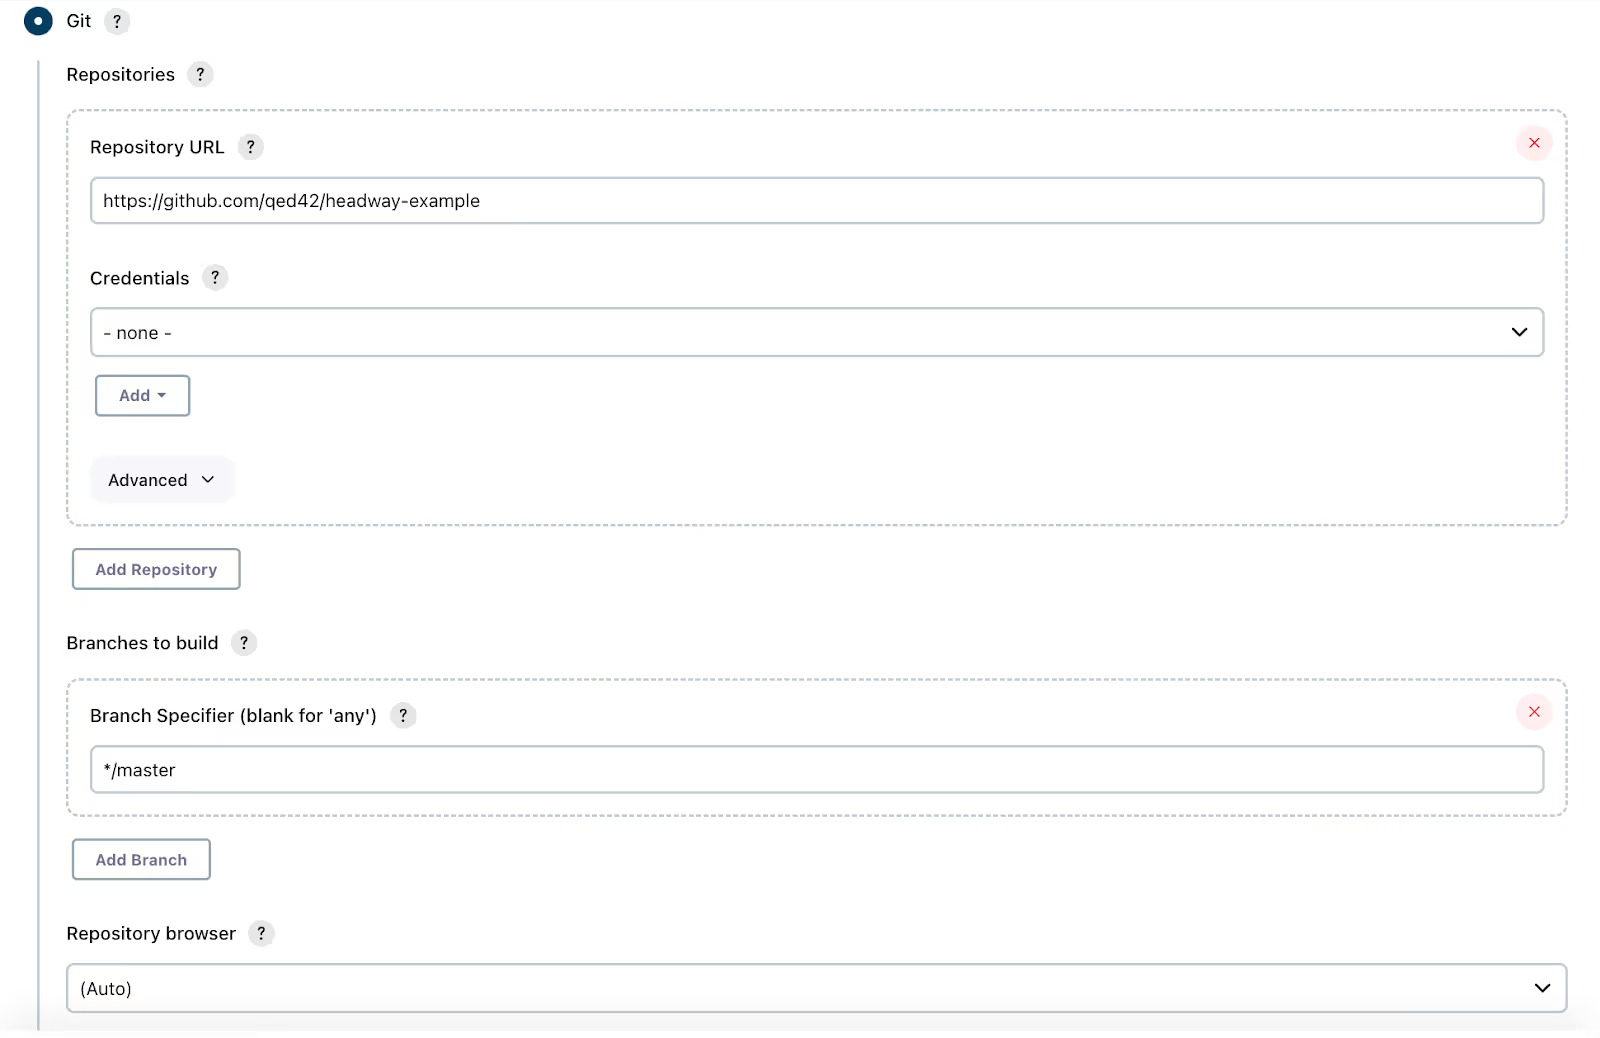
Note : As Headway is open source so no need to enter the credentials of Github.
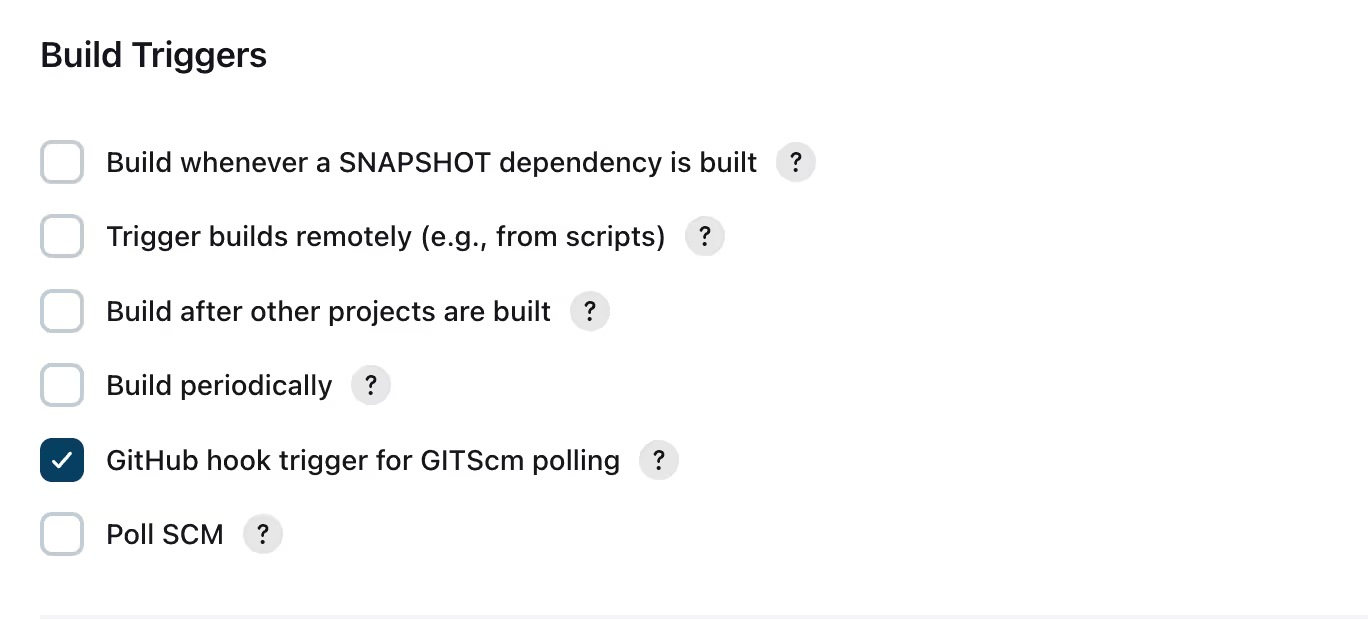
- Build Trigger: Select the option "GitHub hook trigger for GITScm polling".
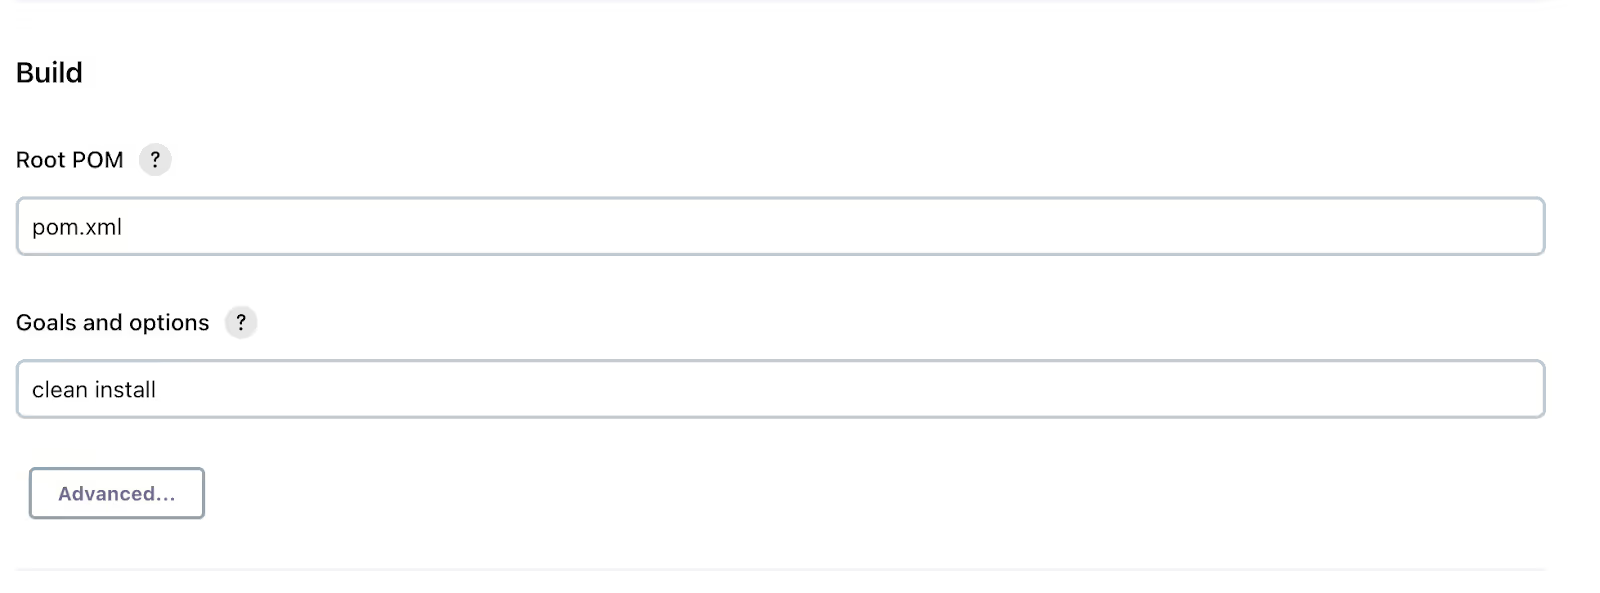
- Build: Provide the relative path to the pom.xml file and enter Maven commands (e.g., "clean install", "test") in the Goals and options field.
- Post-build Actions:some text
- Click on “Add post-build action”
- Add the "Publish HTML reports" post-build action, specify the path and file name.
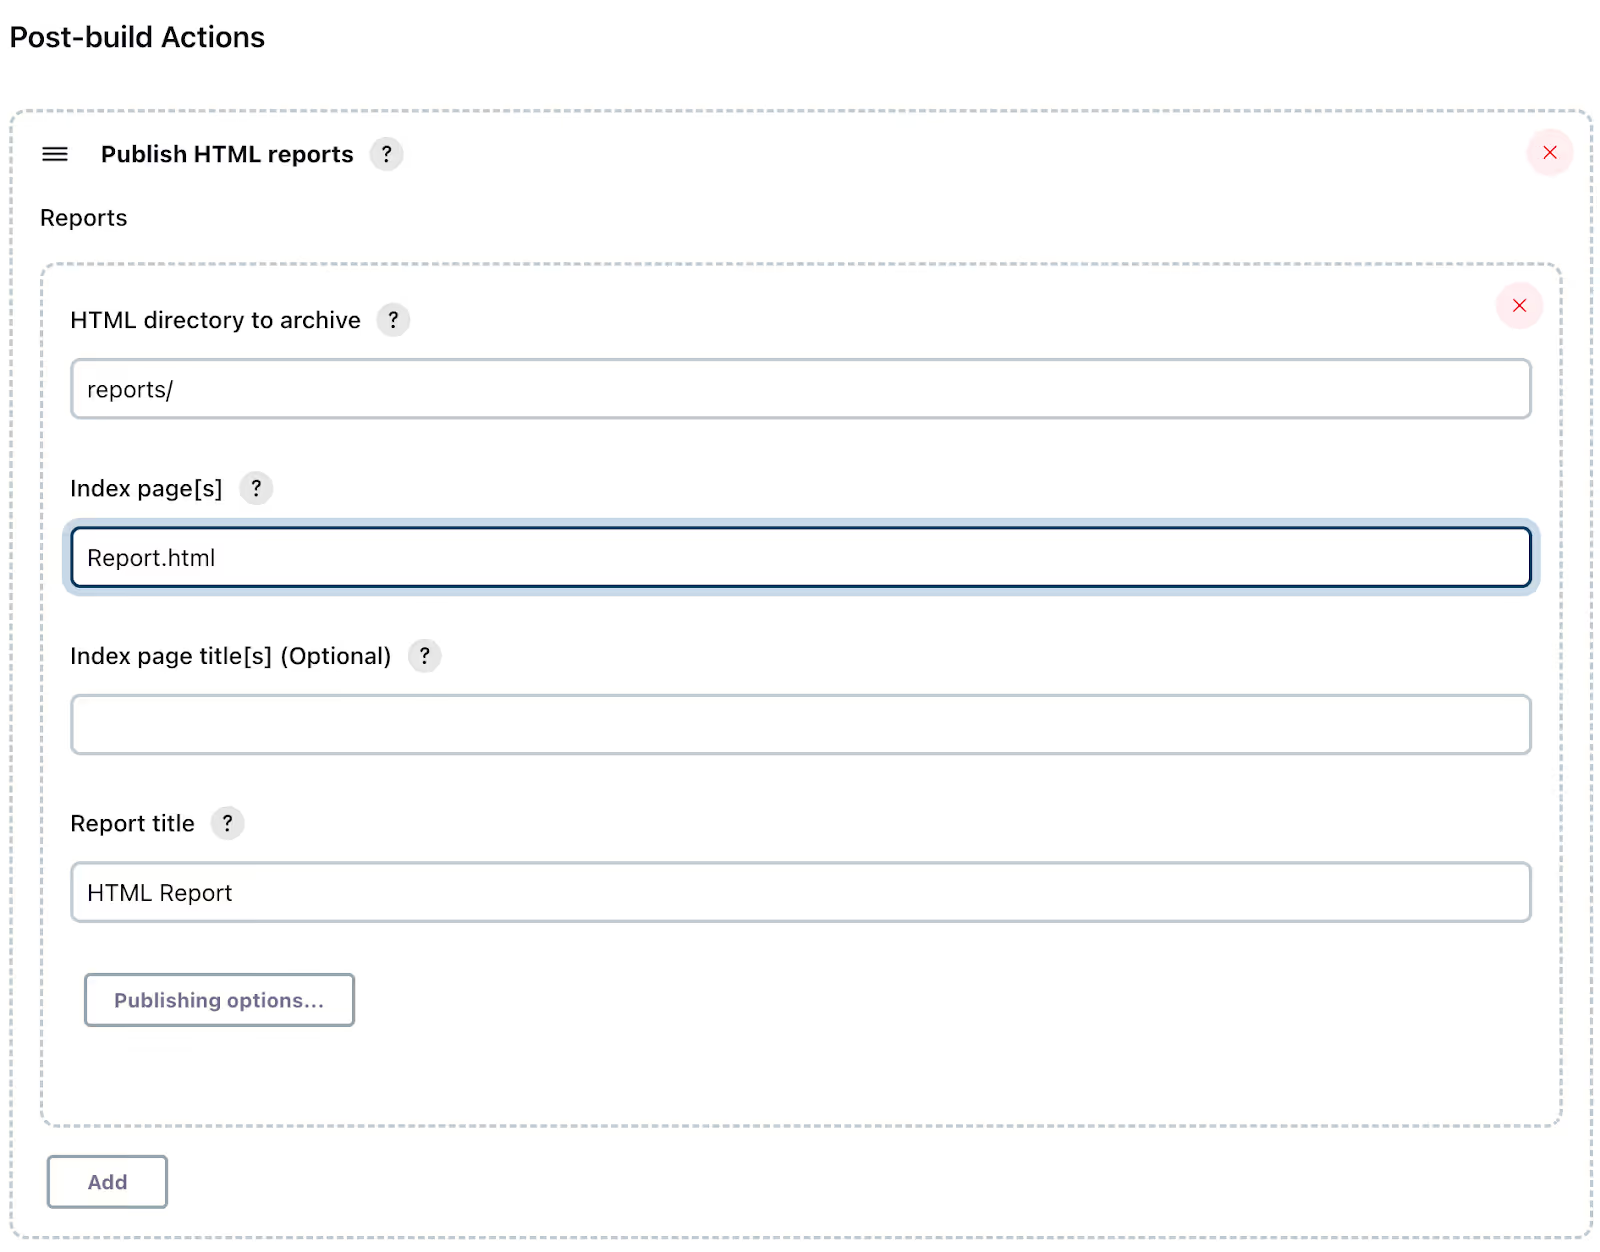
- Click on Publishing options. Enable "Keep past HTML reports" and "Always link to last build" options.

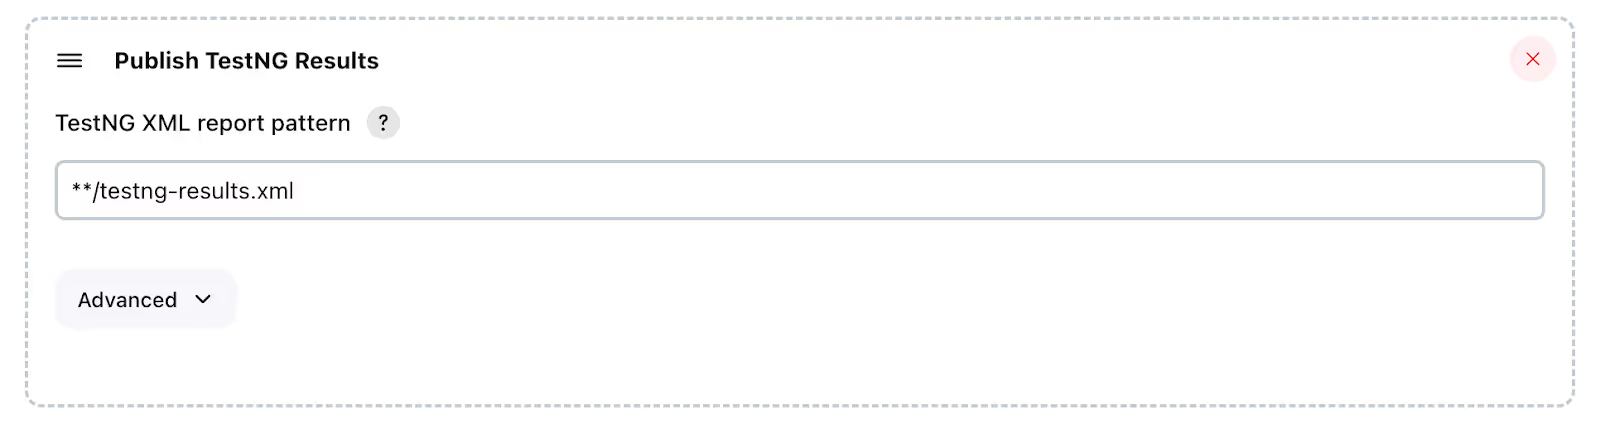
- Again click on “Add post-build action” and add the "Publish TestNG Results" post-build action (optional).
- Click "Apply" and save the configuration. Finally the project is successfully configured.
Execution of Jenkins Job
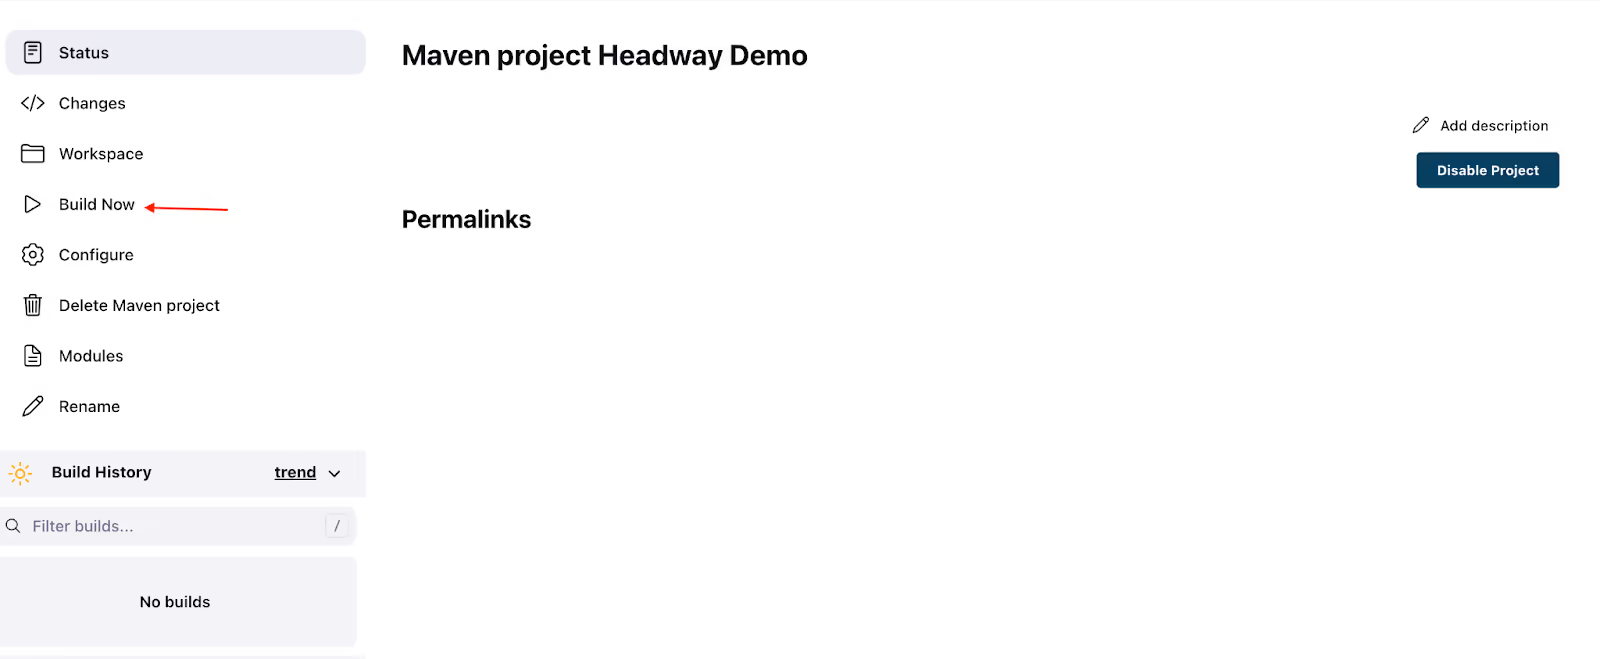
- Click "Build Now" to run the test suite.
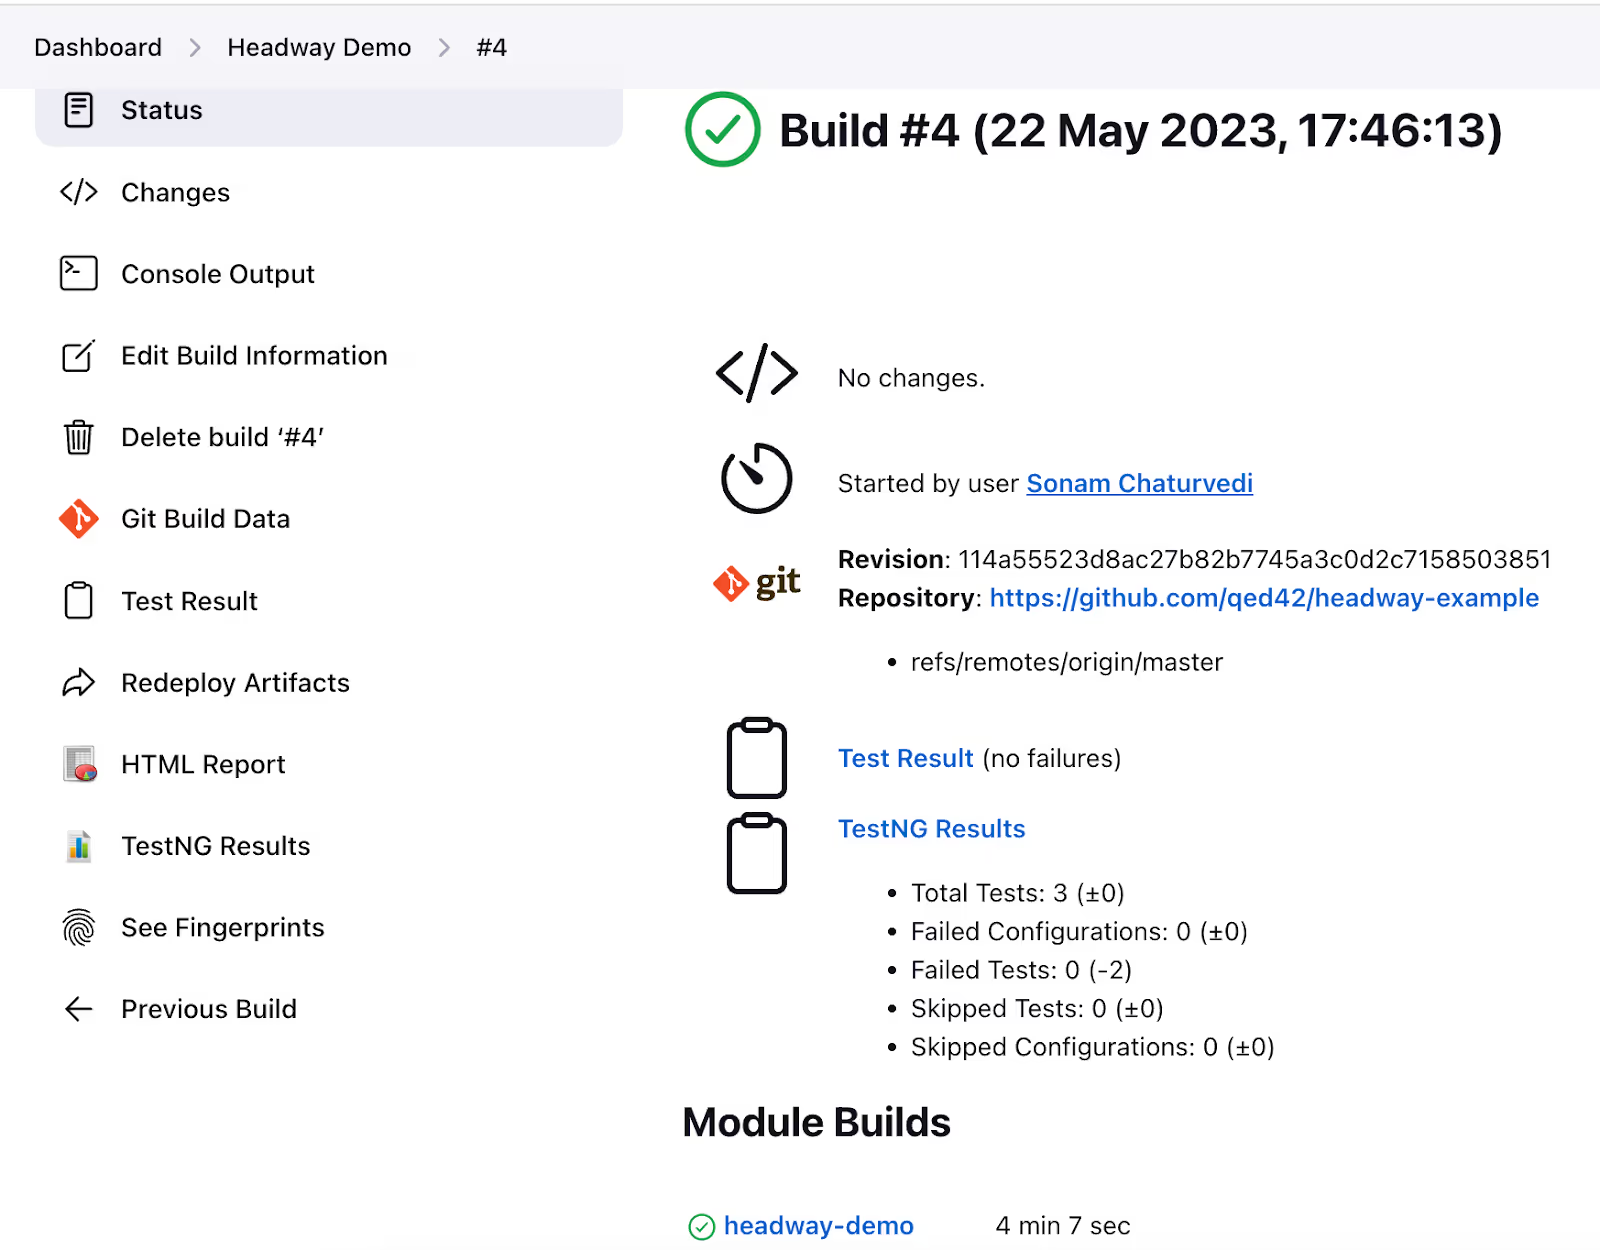
- Monitor the progress by clicking on the build number in the Build History section.
- View detailed execution logs by clicking on "Console Output".
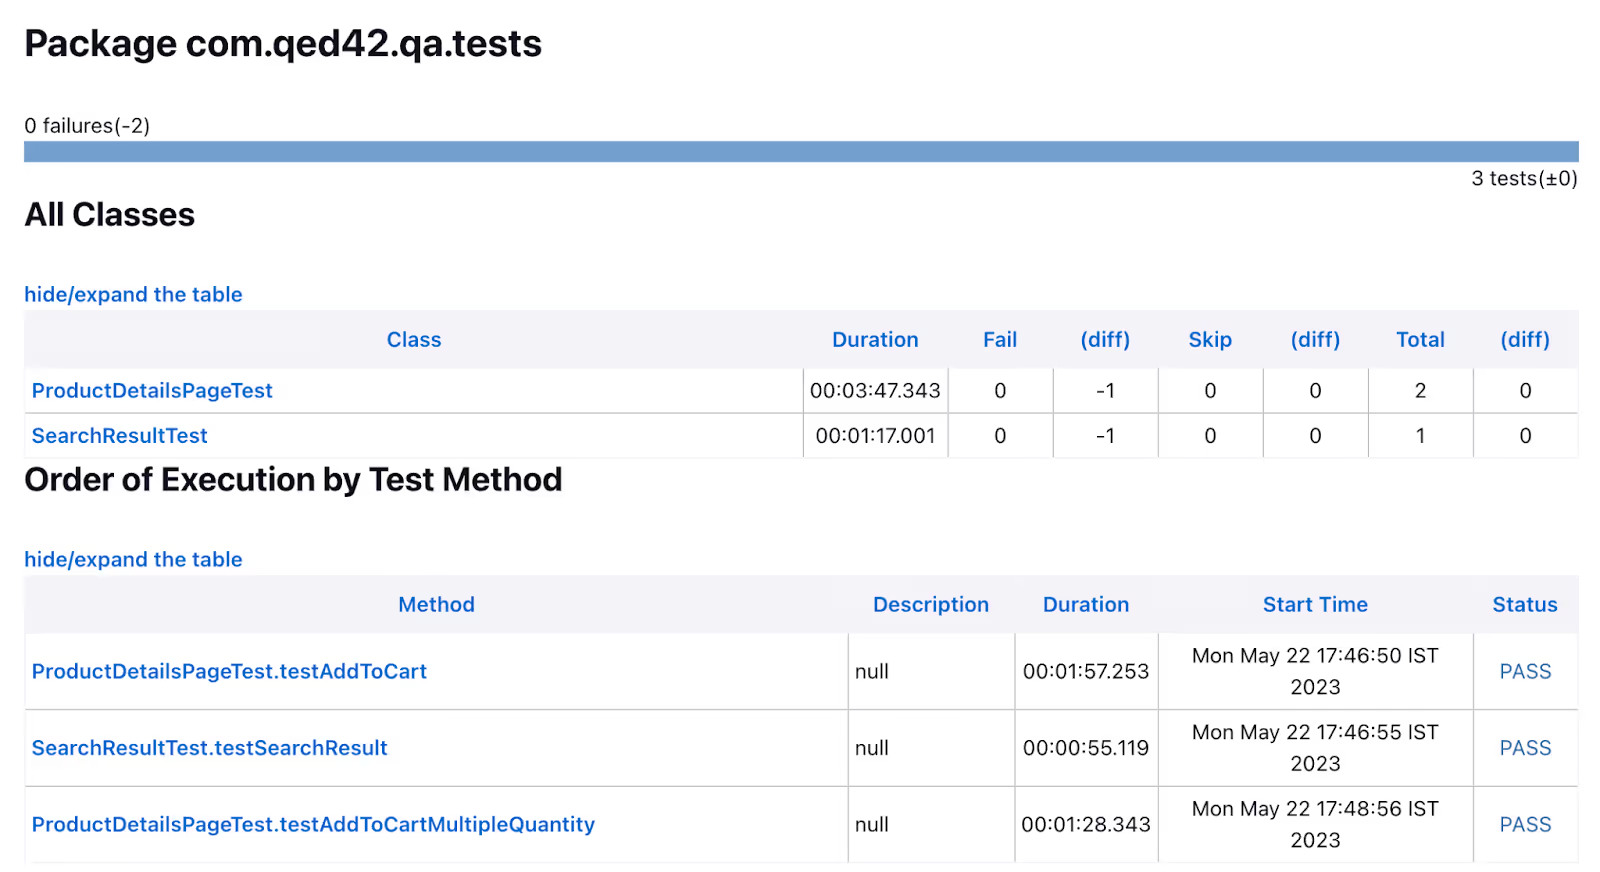
- Access the Extent Report by clicking on "HTML Reports".
- Check the TestNG report by clicking on "TestNG Results".
Conclusion
By following this guide, you have successfully integrated Headway with Jenkins for an efficient CI/CD workflow. You learned how to configure Jenkins jobs, execute test suites, and access relevant reports and logs. With this knowledge, you can enhance your development process by automating tasks and ensuring smoother software delivery through CI/CD.

A step-by-step guide to scripting automation tests using Headway
Introduction
Headway is a data-driven testing framework that uses Selenium to automate web-based applications. It provides a platform for creating and managing automated tests to be used by QA teams to test web applications thoroughly.
These automated tests can be run repeatedly, ensuring consistent and reliable results. By automating repetitive and time-consuming tasks, QA teams can focus on more complex testing scenarios, such as edge cases, negative testing, and usability testing.
Headway allows QA teams to create and execute tests without requiring deep technical knowledge. The user-friendly interface and intuitive workflow enable QA professionals to create and manage test suites with ease, making the testing process more efficient and productive.
Find more information on features and benefits by visiting Headway’s Landing page.
In this blog, we will cover the following topics:
- Setting Up Your Environment
- Best Practices and Creating Your First Headway Test
- Test Execution and Reporting
- Integrating Headway with Continuous Integration (Jenkins)
Each topic will be discussed in detail, providing insights and practical guidance to help you leverage the Headway testing framework effectively.
Now, let's delve into each of these topics in separate child blogs.
Setting Up Your Environment
This blog will guide you through the process of setting up your environment for Headway testing. It will cover the prerequisites, installation steps, and configuration of test settings. Whether you're using Java, Maven, Selenium WebDriver, TestNG, or Eclipse, this blog will provide detailed instructions to ensure a smooth setup.
Link: Headway : Setup the Environment
Best practices and creating your first test
In this blog, we will explore the best practices for writing efficient and maintainable Headway tests. We will discuss the Page Object Model (POM) design pattern and its benefits in organizing test code.
We will also provide a step-by-step guide on the basic structure of a Headway project, including the organization of pages, tests, and test data. You will learn how to define element locators, action methods, and assertions in your test classes. With a practical example of searching for a product on Amazon.in, you will gain hands-on experience in writing Headway tests.
Link: Headway : Best practices and Create First Test
Test execution and reporting
In this blog, we will explore the process of executing Headway tests using testng.xml and generating comprehensive test reports. We will cover how to configure the testng.xml file to define test suites, include or exclude test classes, methods, or groups, and set up test parameters, test data, or test environment configurations.
Link: Headway : Test Execution and Reporting
Integrating Headway with Continuous Integration (Jenkins)
In this blog, we will guide you through the integration of Headway with the popular continuous integration tool, Jenkins. You will learn how to install Jenkins and the necessary plugins, configure a Jenkins job to build and test your Headway project and view the test results of the Headway HTML report. With this integration, you can automate your CI process and leverage the benefits of frequent integration and testing.
Link: Headway Integration with CI/CD: Step-by-Step Guide
Conclusion
In this blog post, we explored the essential aspects of Headway and its significance in automation testing. We covered various topics to help you get started with Headway and maximize its potential for efficient test automation. Integrating Headway with popular CI tools such as Jenkins can help automate the testing process, ensure consistent test execution, and provide quick feedback on any potential issues in the codebase.
Explore further documentation, practice writing Headway tests, and continue learning about advanced topics to enhance your test automation capabilities. Incorporating Headway into your test automation strategy will help you streamline your testing efforts and achieve more efficient and accurate results.

Headway : Test Execution and Reporting
Introduction
Proper execution and reporting of automation tests play a crucial role in ensuring the reliability and effectiveness of your automation testing efforts. We will learn how to configure the testng.xml file, execute automation tests using testng.xml and pom.xml, and generate comprehensive test reports.
Let's dive in!
Testng.xml configuration
- Suite name: Update suite name as per your testing requirements. For example, if you need to run the regression tests, you can update the suite name as “Regression Suite”.
- thread-count: This attribute is used to pass the number of maximum threads to be created.
- parallel: The parallel attribute on the <suite> tag can take one of following values:
- parallel="methods": TestNG will run all your test methods in separate threads. Dependent methods will also run in separate threads but they will respect the order that you specified.
- parallel="tests": TestNG will run all the methods in the same <test> tag in the same thread, but each <test> tag will be in a separate thread. This allows you to group all your classes that are not thread safe in the same <test> and guarantee they will all run in the same thread while taking advantage of TestNG using as many threads as possible to run your tests.
- parallel="classes": TestNG will run all the methods in the same class in the same thread, but each class will be run in a separate thread.
- parallel="instances": TestNG will run all the methods in the same instance in the same thread, but two methods on two different instances will be running in different threads.
- parallel="none": TestNG will run all the tests in the non-parallel mode.
- listeners: The TestNG listens to the “TestListener” class that implements ITestListener interface. It is already added in the testng.xml file provided in the Headway. You can add more listeners that you implement in your respective project.
- test: A test is represented by <test> and can contain one or more TestNG classes.
- parameter: For any tests, you can pass a browser parameter. In case, nothing passed, then tests will run on chrome browser.
- class: A TestNG class is a Java class that contains at least one TestNG annotation. It is represented by the <class> tag and can contain one or more test methods. You can add classes of which tests are to be run.
Automation Test Execution using testng.xml
- Configure testng.xml:
- Modify the existing testng.xml file to define the automation test suite(s) and their configurations.
- Specify the test classes, test methods, or groups to include or exclude from the test execution.
- Set up any necessary test parameters, test data, or test environment configurations.
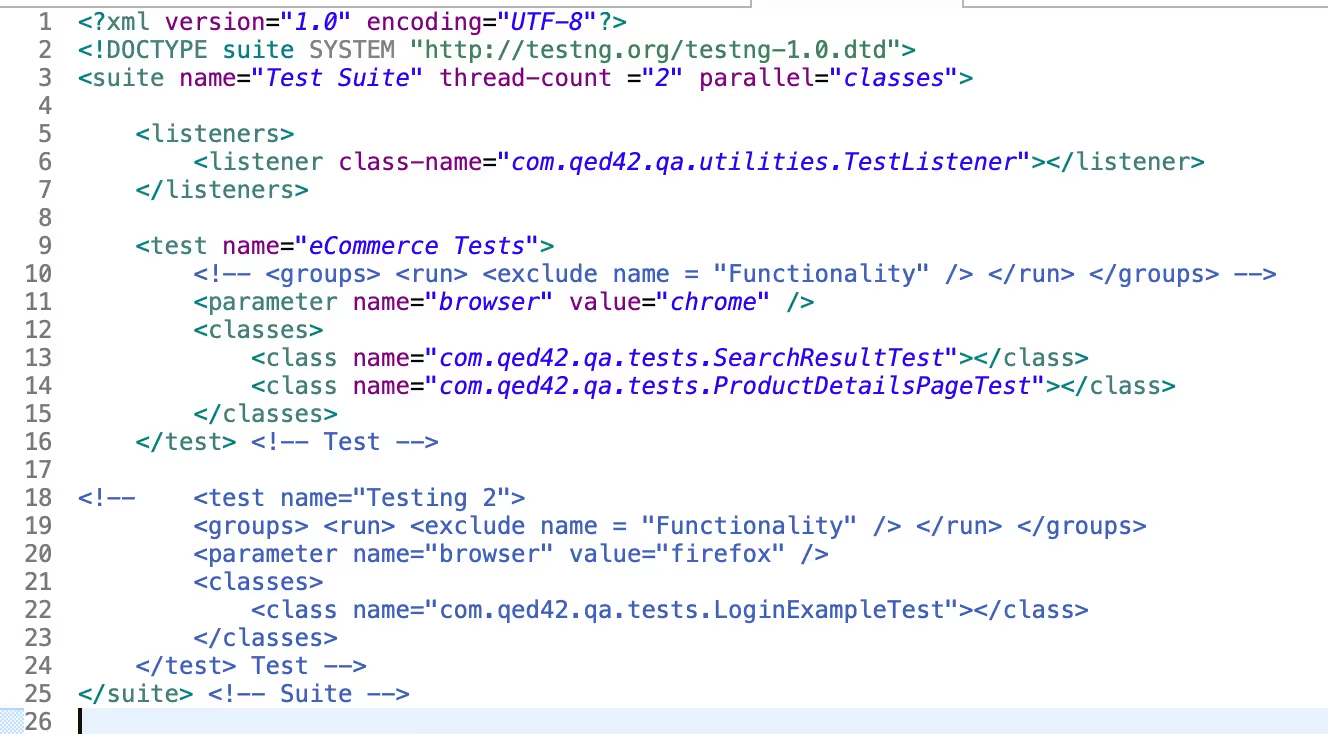
Once the testng.xml file is updated, run tests using testng.xml.
- To run a complete test suite: Run the test by right clicking on the TestNG xml file and select Run As -> TestNG Suite.
- To run individual class containing tests: Run the test by right clicking on the test class file and select Run As -> TestNG
You can refer to section 3.4. Updating the existing testng.xml of Headway user guide to get more information on how to update testng.xml using different parameters.
Build and Execution
Automation test execution using testng.xml and pom.xml involves utilizing TestNG and Maven as the tools for configuring and running tests. The Headway includes a build automation file pom.xml that defines the project dependencies and build configurations. Automated tests can be executed using a build tool Maven, or through an integrated development environment (IDE) that supports running tests.
Test Execution Workflow using testng.xml and pom.xml :
- Configure pom.xml:
- In the pom.xml file, the TestNG plugin configuration is already added to enable automation test execution using Maven Surefire plugin.
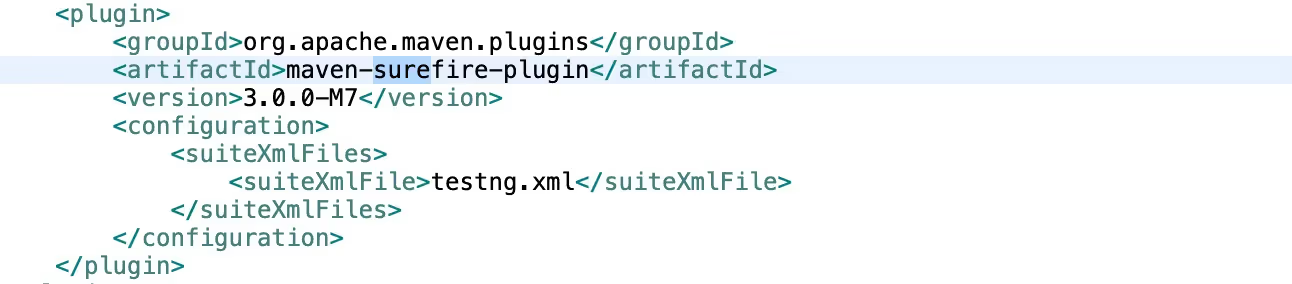
- Configure the TestNG plugin to point to the location of the testng.xml file.
- Set up additional configurations such as test output directories, test failure thresholds, and test report generation options.
- Run Tests:
- Open a command-line interface or an integrated development environment (IDE) that supports Maven.
- Navigate to the project directory containing the pom.xml file.
- Execute the test
- When using terminal : Execute the Maven test command (mvn test) to trigger the test execution.
- When using IDE Eclipse : Right-click on POM.xml -> Run -> Maven test.
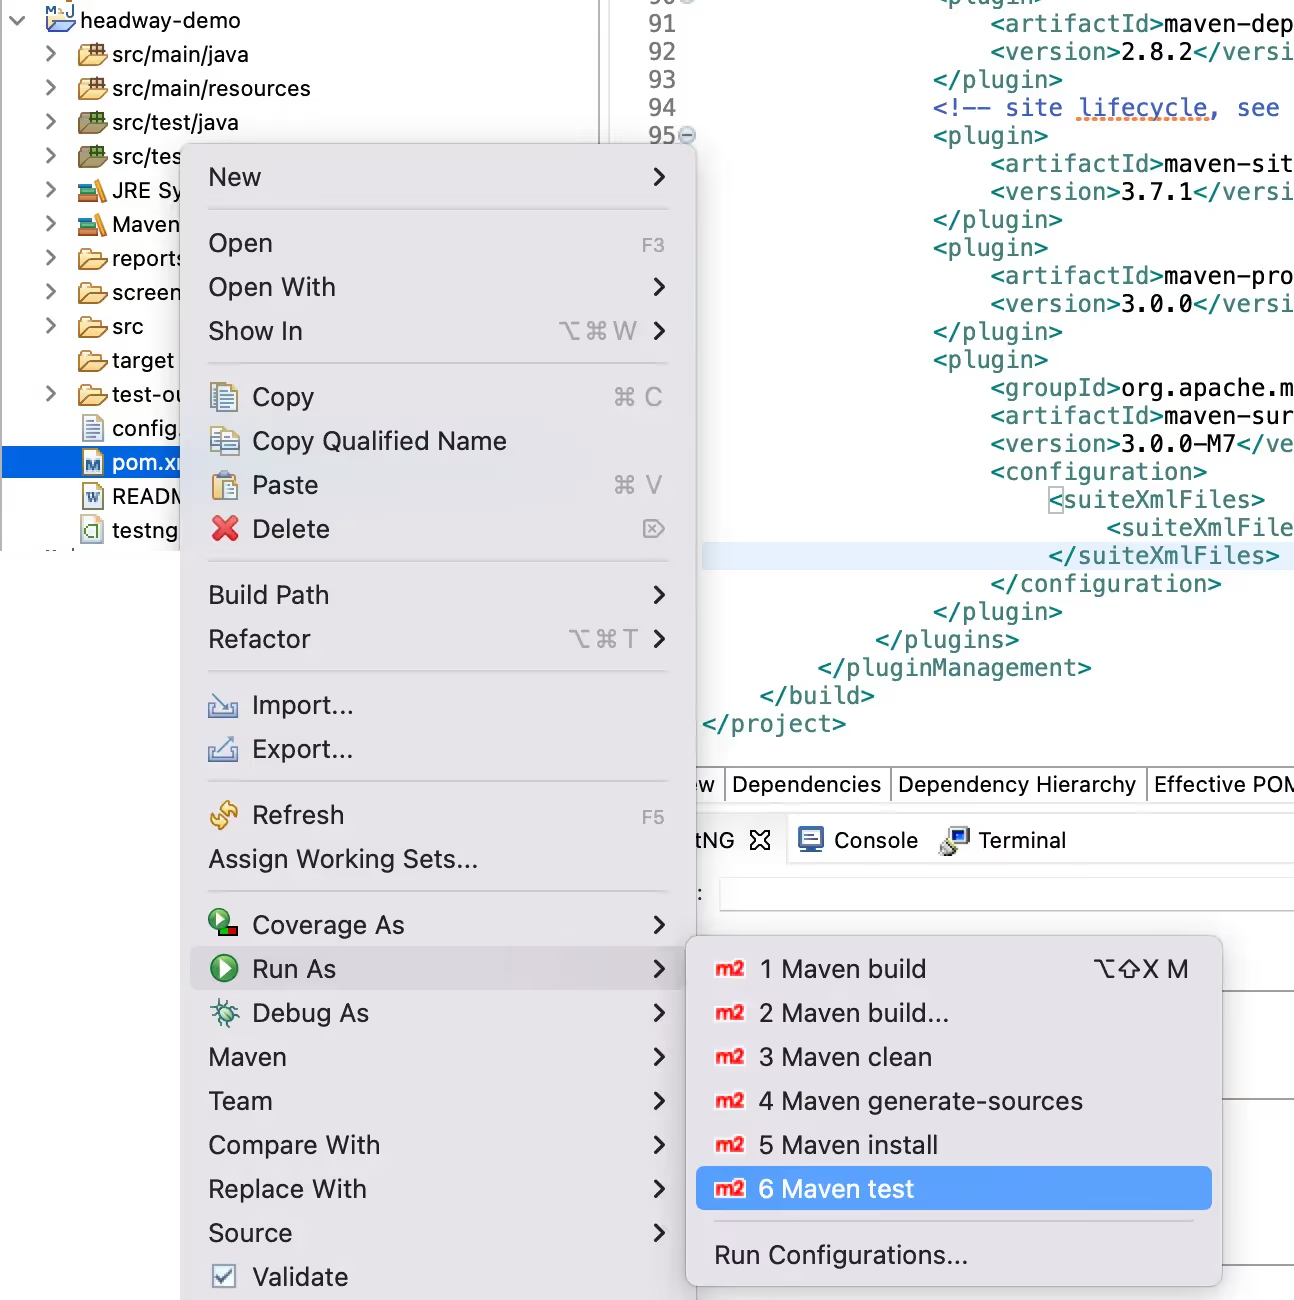
- Maven reads the pom.xml file, identifies the TestNG plugin configuration, and runs the tests according to the specified testng.xml file.
Test Report Generation
- After the test execution completes, TestNG generates a test report based on the results.
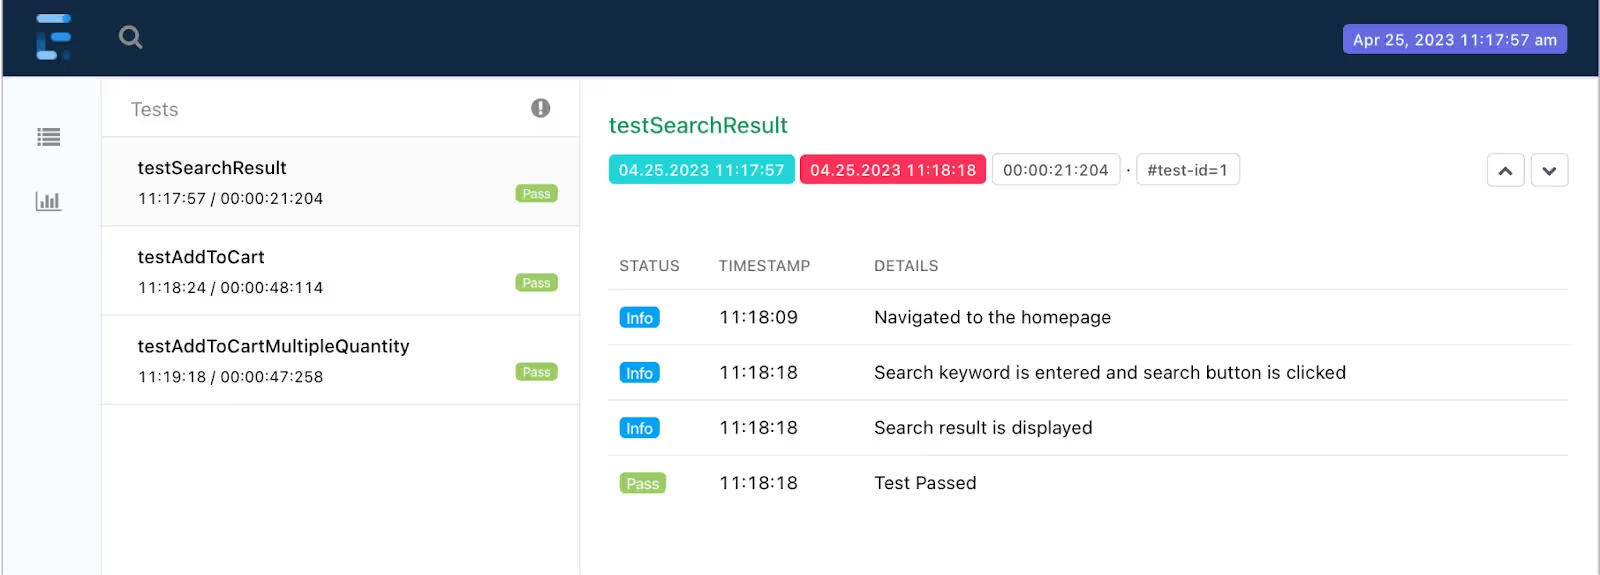
- Test report is created in HTML format and provides detailed information about the executed tests, including test status, duration, error messages, and stack traces.
- The test report can be accessed using below steps
- Open “/reports/Report.html” report file and check the test results.
- Check the screenshot files are captured under this “screenshots” directory for failed tests.
Conclusion
In conclusion, effective test execution and reporting are vital components of a successful testing strategy. By properly configuring the testng.xml file and utilizing the power of Maven and TestNG, you can streamline your test execution process and obtain detailed test reports. These reports provide valuable insights into the test results, including test status, duration, error messages, and stack traces. By leveraging the information provided in the reports, you can identify and address any issues or failures in your tests promptly.

Headway : Best practices and Creating Your First Test Automation
Introduction
Now that you have set up your environment, it is essential to follow best practices when writing automation tests. These practices ensure maintainable, efficient, and reliable test code. This blog will discuss the best practices for writing Headway tests, including the Page Object Model (POM) design pattern and will also guide you through the basic structure of a Headway project, including the organization of pages, tests, and test data. It will also provide a sample code snippet of a Headway test class to search for a product on amazon.in.
Best Practices for Writing Headway Tests
The Page Object Model (POM) is a design pattern used in test automation to represent web pages as objects and organize them in a hierarchical manner. Each page is represented as a class that contains all the elements and actions that can be performed on that page. The POM pattern separates the page logic from the test code, making the automated tests more readable, maintainable, and reusable. The Headway framework employs the Page Object Model (POM) design pattern.
Benefits of using POM in organizing test code:
- Reusability: POM allows the same page object to be reused across multiple automation test cases, reducing the amount of redundant code and making tests more efficient.
- Maintainability: POM separates the page logic from the test code, making it easier to maintain and update test cases when changes are made to the page structure or functionality.
- Readability: POM provides a clear and organized structure for test code, making it more readable and understandable for developers and other stakeholders.
How to write maintainable and efficient automation tests using Headway:
- Use reusable functions: Create reusable functions for common actions such as clicking buttons, filling out forms, or navigating between pages. This will reduce the amount of duplicate code in your tests and make them more efficient.
- Use meaningful names: Use descriptive and meaningful names for your variables, functions, and test cases. This will make your code more readable and easier to understand.
- Follow a naming convention: Follow a consistent naming convention for your page objects and functions. This will make it easier to find and update them when necessary.
- Keep tests independent: Make sure that each test case is independent and does not rely on the results of previous tests. This will ensure that your tests are reliable and can be run in any order.
- Use assertions: Use assertions to verify that the expected results match the actual results. This will ensure that your tests are accurate and reliable.
- Use wait functions: Use wait functions to ensure that elements are loaded and ready before interacting with them. This will reduce the risk of errors and make your tests more robust.
Creating Your First Automation Test using Headway
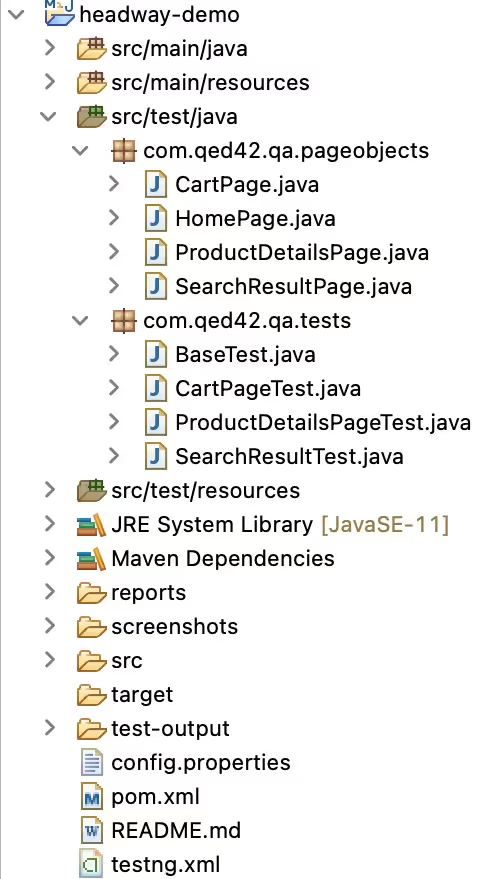
Let's discuss the basic structure of the project:
Pages:
- The src/main/java/com/qed42/pages directory contains Java classes representing different pages of the web application being tested.
- Each page class represents a specific page and includes methods and locators related to that page.
Each page class typically includes:
- Element locators: These are defined using the By class from Selenium to locate web elements using different locators (e.g., ID, CSS selector, XPath).
- Action methods: These methods define the actions that can be performed on the page, such as clicking buttons, filling forms, or interacting with elements.
The headway-example repository project provides an example implementation of using Headway for test automation. For example, you'll find classes like ProductDetailsPage, CartPage, and SearchResultPage representing different pages of the web application.
Below is sample code of SearchResultPage class that is used searching a product on amazon.in :
Tests:
- The src/test/java/com/qed42/tests directory contains Java classes representing the test scenarios for the web application.
- Each test class focuses on testing a specific feature or scenario and utilizes the page classes and their methods.
- The BaseTest class uses TestNG framework annotations to define test methods and setup/teardown methods.
- Test methods are typically annotated with @Test and use the page classes to interact with the web application and perform assertions.
- For example, you'll find classes like CartPageTest, ProductDetailsPageTest and SearchResultTest containing test methods that verify the behavior of the cart and search for the product.
Test Data:
- The src/test/resources directory contains test data files or resources that can be used in the tests, such as sample data in csv or json or test configurations.
Below is sample code of SearchResultTest class that is used searching a product on amazon.in :
You can refer to Chapter 3 of Headway user guide to get more information on how we have automated a few use cases for amazon.in.
Debugging Your Headway Test
Debugging tests is an important part of test automation. Here are some tips and tricks for debugging your Headway tests:
- Add log statements: Insert log statements at critical points in your test code to output relevant information, such as the values of variables, the execution flow, or error messages. Log statements can be printed to the console or written to log files, depending on your logging configuration.
- Use test reports and screenshots: Headway framework generates test reports and captures screenshots during test execution, you can review them to identify any unexpected behavior or errors. These reports can provide valuable insights into the state of your tests and the application under test.
- Inspect element properties: During test execution, you can inspect the properties and attributes of web elements using debugging tools such as browser developer tools. This helps ensure that the elements are correctly located and interacted with in your test code.
- Use breakpoints: Set breakpoints in your automation test code to pause the execution at specific points and examine the state of variables and objects. This allows you to step through the code and identify any issues or unexpected behavior. IDEs like IntelliJ IDEA, Eclipse, or Visual Studio Code provide convenient ways to set breakpoints.
Conclusion
Congratulations on creating your first Headway test! By understanding the structure of a Headway project and utilizing page classes, test classes, and test data, you can create effective tests to automate web application testing. With Headway, you can confidently verify the behavior of web applications and ensure their quality. By following the tips and tricks discussed in this blog, you can enhance your debugging process and ensure the reliability of your tests.

Setting up automated testing environment with Headway: A Step-by-Step Guide
Before getting started with Headway testing, it is essential to set up your automation environment correctly. This involves installing the required dependencies and configuring the test settings. This blog will guide you through the power of setup and necessary steps to set up your environment for the Headway testing framework.
The Importance of Properly Setting up your automation testing environment
- Enhanced Test Coverage: A proper setup is the foundation for effective data-driven testing. By carefully identifying the right datasets and test cases, testers can ensure that a wide range of scenarios and edge cases are covered. This comprehensive test coverage enables early detection of bugs, issues, and inconsistencies, leading to higher software quality and customer satisfaction.
- Increased Reusability: One of the significant advantages of data-driven testing lies in its reusability. A well-designed setup enables test cases to be easily reused across multiple iterations, builds, or versions of the software. This saves valuable time and effort, reduces redundancy, and allows teams to focus on exploring new functionalities and improvements rather than retesting the same scenarios repeatedly.
- Improved Scalability: As software projects grow in complexity, maintaining test suites becomes a challenging task. Proper setup empowers testing teams to scale their efforts seamlessly. By centralizing test data and maintaining it separately from the test scripts, any changes or updates can be made efficiently. Moreover, additional datasets can be easily incorporated to cover new test scenarios without requiring extensive modifications to the test scripts.
- Flexibility and Adaptability: A well-structured setup enables quick and easy modification of test data. As business requirements evolve or when specific scenarios need to be addressed, testers can swiftly update or add new datasets without affecting the core test logic. This flexibility allows testing teams to stay agile and respond promptly to changing project needs, ensuring that software releases remain robust and reliable.
Setting Up Your Environment
Pre-requisites
Installation steps
Clone the Headway repository to your local machine.

Install the required dependencies by running mvn clean install in the root directory
OR
Import project as an existing Maven project in Eclipse, File > Import > Maven > Existing Maven Projects > Next >
a. Browse to headway
b. Ensure pom.xml is found
c. Finish


- Update the config.properties file to configure the test settings such as the browser type and test URL.
- Write your test cases in the src/test/java directory using TestNG annotation and POM design pattern.
- Headway provides example tests. Run these tests to confirm that all setup is successful and completed as expected.
- To run a complete test suite: Run the test by right clicking on the TestNG xml file and select Run As -> TestNG Suite.
- To run individual classes containing tests: Run the test by right clicking on the test class file and select Run As -> TestNG Test.
- Goto “/reports" in the project root directory and verify the “Report.html” and “logfile.log” files are generated.
- Verify the "screenshots" directory is created under the project root directory, when the test fails for the first time.
- And the screenshot files are captured under this “screenshots” directory for failed tests.
You can refer to Chapter 2 of Headway user guide for more information on setup and installation.
Conclusion
Setting up your environment correctly is crucial for successful Headway testing. By following the installation steps and configuring the test settings, you can ensure that your testing environment is ready to create and execute tests using Headway. A properly set up environment lays the foundation for effective and efficient testing with Headway.
.avif "Selenium Manager: Automated Testing with Streamlined WebDriver Management")
Selenium Manager: Automated Testing with Streamlined WebDriver Management
In the fast-paced world of software development, ensuring the quality of your applications is paramount. Automated testing has emerged as a cornerstone of quality assurance, and Selenium has long been a favored tool for automating web application testing.
With the introduction of Selenium Manager in version 4.6.0, there is a commitment to streamline and improve the automation process. In this blog, we'll delve into what Selenium Manager is, its purpose, how it addresses challenges faced by its predecessor WebDriverManager, and even provide a practical demonstration.
What is Selenium Manager?
Selenium Manager is a robust automation tool designed to facilitate the process of automated testing of web applications. It provides a centralized platform to manage WebDriver binaries, making it easier to set up and manage browser drivers for Selenium automation.
This tool takes a step beyond WebDriverManager and aims to streamline the configuration and execution of tests, ultimately leading to more efficient and effective testing practices.
The Purpose of Selenium Manager: Why was it Introduced?
Automated testing is pivotal for maintaining software quality, but setting up and managing browser drivers for Selenium-based testing was not without challenges. WebDriverManager, though helpful, left room for improvement.
Selenium Manager was introduced to address these shortcomings, aiming to provide a more centralized, streamlined, and user-friendly experience. It simplifies the process of managing WebDriver binaries and ensures that the correct driver versions are used across different environments.
Problem / Challenge faced before Selenium Manager
Prior to Selenium Manager, managing WebDriver binaries was often a manual and error-prone process. Teams had to juggle between different browser versions and their corresponding drivers, leading to compatibility issues and wasted time.
WebDriverManager alleviated some of these concerns, but it still required manual configuration and lacked a unified platform for managing drivers across projects.
How does it replace WebDriverManager?
Selenium Manager improves upon WebDriverManager by offering a centralized management solution. It automates the process of downloading and setting up WebDriver binaries for various browsers, saving developers the hassle of manually managing driver versions.
Additionally, it provides integration with popular testing frameworks, making it seamless to incorporate into existing testing workflows.
Demonstration using code example
Let's take a quick look at how Selenium Manager can be integrated into an automated testing script using Java and TestNG:
Conclusion
Selenium Manager is a significant advancement in the world of automated testing. It addresses the challenges faced by its predecessor, WebDriverManager, and streamlines the management of WebDriver binaries.
Embracing Selenium Manager can greatly enhance the automated testing process. Its centralized management of WebDriver binaries, along with its integration with testing frameworks, makes it a valuable tool for any testing team.

Spot, Tag, Resolve: BugHerd's Role in Tracking UI issues
BugHerd is a visual feedback and web-based bug-tracking tool designed specifically for web development and design projects. BugHerd allows teams to report and track bugs, issues, and feedback directly on a website, making it particularly useful for collaborative web development projects.
Bugherd Setup
The BugHerd sidebar can be added to a webpage in two different ways. You may choose to :
- Install a browser extension
- Install some Javascript code
Install a Browser Extension
- Visit the Chrome webstore page
- Click the Add to Chrome button in the top right corner of the page.

3. Click the "Add extension" button to complete the installation.

Capturing UI Issues
1. Add the project name and the URL of the site.

2.Then a pop-up will appear.

3. Click on the ‘Report an issue on your site’.
4. Then it redirects you to the site.

5. On the site where you want to track the bug, just simply click on the area.

6. Lock the bug and include details such as the bug's severity, tags, and current state. Then proceed to assign it directly.

7. Click on the ‘Create task’ button.

8. You can see the task is added on the site.

9. Tag the Page: Click on the ‘Tag the Page’ icon

10. Click on the task to check the issue where users can see the Tag page location.

- Record the video: Click on the ‘Video feedback’ option to record the issue.


a. After recording the video, write the issue, select the severity of the issue and assign the issue to the developer and then click on the create button.

b. After creating the task, the user can see the task by clicking on the task icon where users can play the video to see the issue.

Task Board

User can also add the column in workflow by clicking on ‘Plus’ icon

Collaborative Issue Resolution
Team members can collaborate more easily with BugHerd, which makes the resolution process more streamlined and effective.
Pros
- Visual Feedback: By clicking on items on a webpage, users can submit visual feedback using BugHerd, which makes it simple to identify problems on the website itself.
- Real-Time Collaboration: Teams can work together in real-time by exchanging task statuses, providing comments, and attaching files. This expedites the settlement of problems and improves communication.
- Integration with Development Tools: Jira and Trello are just two of the well-known development tools that BugHerd interacts with to make it easier for developers to prioritize and take care of UI bugs.
- Task Management: Using BugHerd, UI problems are turned into doable tasks that are assigned to individual team members for effective and accountable resolution.
- User-Friendly Interface: The platform's user-friendly interface makes it suitable for team members who are not technical as well as those who are.
Cons
- Limited Customisation: When compared to other bug-tracking software, some users may think that BugHerd lacks some sophisticated customisation possibilities.
- Dependency on Browser Extension: Users who prefer tools that don't require installing browser-specific software may find that the requirement for a browser extension is a barrier.
- Subscription Cost: For smaller teams or users on a tighter budget, BugHerd's subscription cost may be a disadvantage, contingent on the size and requirements of the team.
- Limited Automation: BugHerd has limited automation capabilities compared to some other project management solutions, although offering interface with other applications.
JIRA Integration
Jira is a versatile team project management and issue tracking tool widely utilized by software development teams. It facilitates efficient planning, tracking, and management of work. Supporting agile methodologies with Scrum and Kanban boards, Jira provides flexibility in work visualization. The tool plays a crucial role in enhancing team collaboration, boosting productivity, and ensuring project success.
Jira's flexible workflow engine empowers teams to define and customize their own processes, allowing the tool to adapt to the unique needs of different projects. Additionally, Jira seamlessly integrates with a wide range of third-party tools and plugins. This integration enhances collaboration and expands functionality, making Jira a dynamic solution capable of meeting diverse project requirement
Connecting Jira with Bugherd
- In BugHerd, navigate to the project settings.
- Click on ‘Integration’.

- A pop-up will appear for integrating with other tools.

- Choose Jira for integration.

- Now, Jira tool is enabled

Managing BugHerd issues in JIRA:
For UI issues, tasks are created and added to Backlog in BugHerd. And once Bugherd is mapped to the relevant JIRA project and/or Epic, we can send these tasks with details (task title, description, screenshot) to the JIRA task manually.
We can also send tasks and updates to JIRA automatically using BugHerd-Jira integration settings.
- We can enable the option to automatically create a JIRA ticket with all details when a task is moved to a particular state (e.g. TO DO).
- We can enable the option to Sync comments between BugHerd and JIRA tasks.
- We can enable the option to update Bugherd task status once an associated JIRA task is completed.

Conclusion
When it comes to fighting UI problems, BugHerd has shown to be an invaluable ally. Teams aiming to provide flawless user experiences will find its visual feedback capabilities, collaboration features, and easy-to-use interface to be very suitable. Development teams may guarantee that UI issues are found and fixed quickly by configuring BugHerd for UI issue tracking, effectively documenting issues, and utilizing its collaborative resolution tools. This will improve user happiness and result in a polished end product.
_0.avif "A Beginner's Guide to Sitemap Testing: Part 2")
A Beginner's Guide to Sitemap Testing: Part 2
Sitemaps are crucial for helping search engines understand websites. When sitemaps are invalid, they make it difficult for search engines to crawl new pages efficiently. Regularly checking the sitemap is important to ensure that search engines can read it.
In our previous blog post, 'A Beginner's Guide to Sitemap Testing: Part 1', we gave a quick overview of different sitemap types like XML, mobile, video, and image sitemaps.
In part 2, lets dive and explore popular tools that can ensure that a sitemap is correctly formatted, error-free, and optimized for search engines. By the end of this post, you will be well equipped to test your sitemap like pro!
Test cases for sitemap testing
To ensure that the website's sitemap is functioning properly, consider the following test cases:
- Validate the structure: Verify that the sitemap is formatted properly and follows the correct XML schema. Test that the sitemap starts with the <?xml version="1.0" encoding="UTF-8"?> tag and ends with the closing </urlset> tag.
- Verify all URLs: Verify that all URLs in the sitemap are accessible and return a 200 HTTP status code. Test whether all URLs are valid and reachable.
- Check for duplicate URLs: Test whether the sitemap does not contain any duplicate URLs.
- Verify any broken links: Test whether all URLs in the sitemap are valid and do not return a 404 or other error status code.
- Check for redirects: Test to ensure none of the URLs redirect to another URL.
- Check for correct hierarchy: Verify that the URLs in the sitemap are organized in a logical structure with the main pages at the top and the sub-pages nested underneath.
- Check the size: Test that the sitemap is not too big, as large sitemaps are burdensome for search engines to process.
- Check the frequency: Test whether the frequency of page updates is set correctly.
- Check the priority: Test whether the page priority is set correctly.
- Verify on different devices and browsers: Test that the sitemap is fully responsive and compatible with multiple devices and browsers.
- Test sitemap submission: Test submitting the sitemap to search engines like Google, Bing, and others using the webmaster tools to check if it is indexed and if there are any errors.
By creating and executing these test cases, it can ensure that the sitemap is accurate, up-to-date, and error-free, which will help search engines better understand and crawl the website.
Testing sitemaps using various tools
Google Search Console
Check the submitted sitemap in Google Search Console:
- Navigate to the "Sitemaps" section under the "Index" tab in the sidebar.
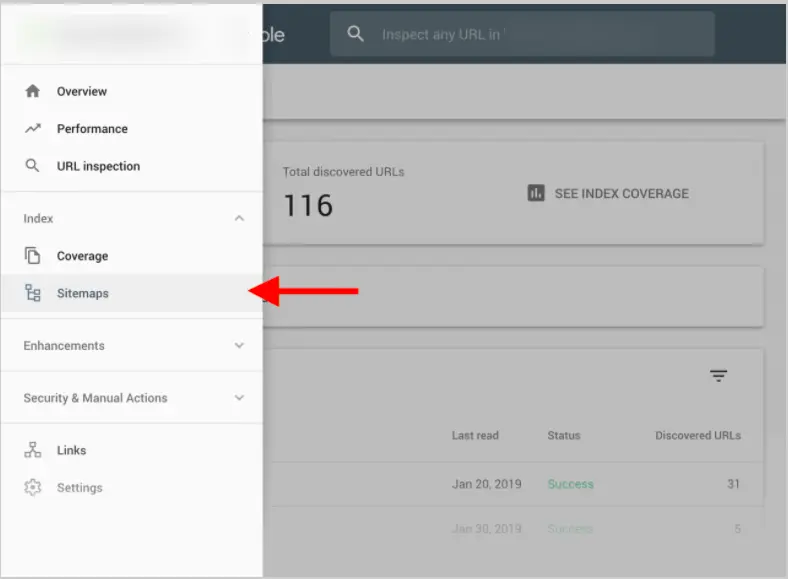
- View the status and details of the submitted sitemaps by navigating to the sitemaps report in the website's search console.
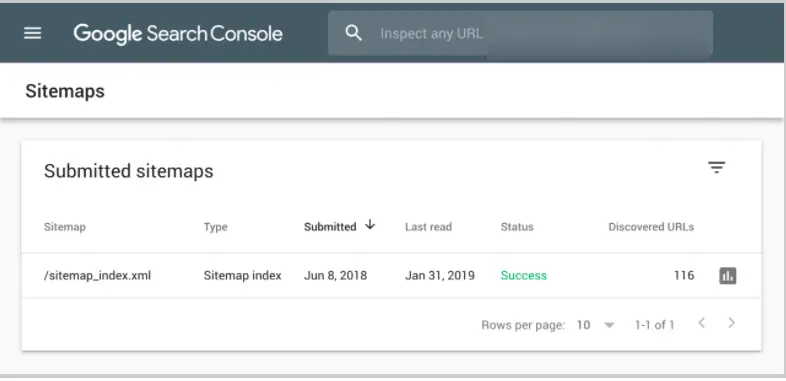
Check the "Submitted Sitemaps" section on this page for information about the sitemap.
- Upon successful process of the sitemap index, it signifies that Google has successfully crawled and analyzed the sitemap, ensuring seamless navigation and understanding of the website content.
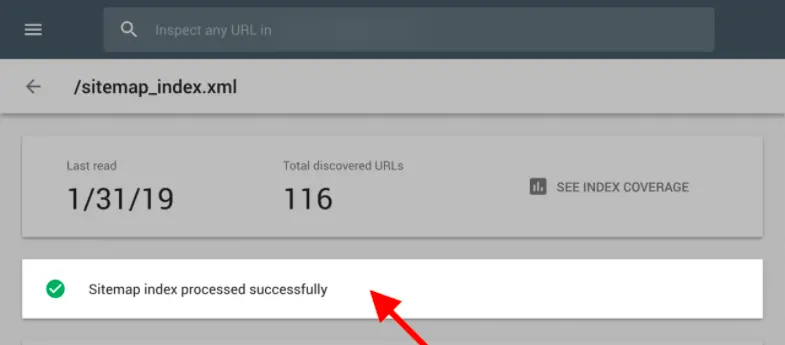
- To check the Coverage Report for the sitemap, click on “SEE INDEX COVERAGE”
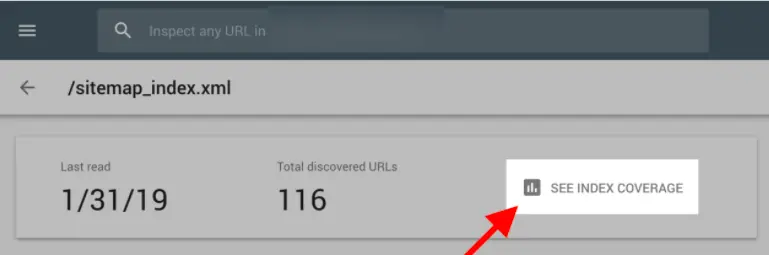
- Using the coverage report check how many URLs Google found in the sitemap and how many of those pages ended up in the Google index.
- The sitemap report displays the number of web pages and the status of each URL. It can include the number of valid URLs, any excluded URLs, and other relevant information.
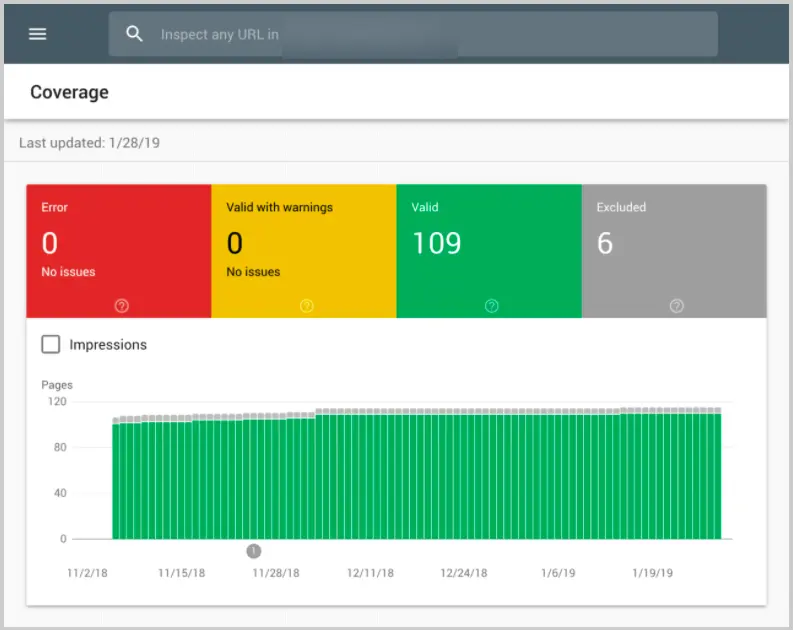
- Check the error of any “Excluded” pages.
.webp)
6 URLs in the sitemap are getting a “Duplicate, submitted URL not selected as a canonical” message. These pages should not be indexed, so it should be removed from the sitemap.
XML Sitemap Validator
XML sitemap validator is a tool that checks if a sitemap follows the standard protocol and has all the required elements and attributes. It can also find errors, like invalid URLs or incorrect formatting, and suggest solutions.
The validator makes sure that search engines can crawl and index the website correctly and identify any issues that could affect the site's search engine rankings. There are several free XML sitemap validators available online, such as the W3C Markup Validation Service and XML Sitemap Validator.
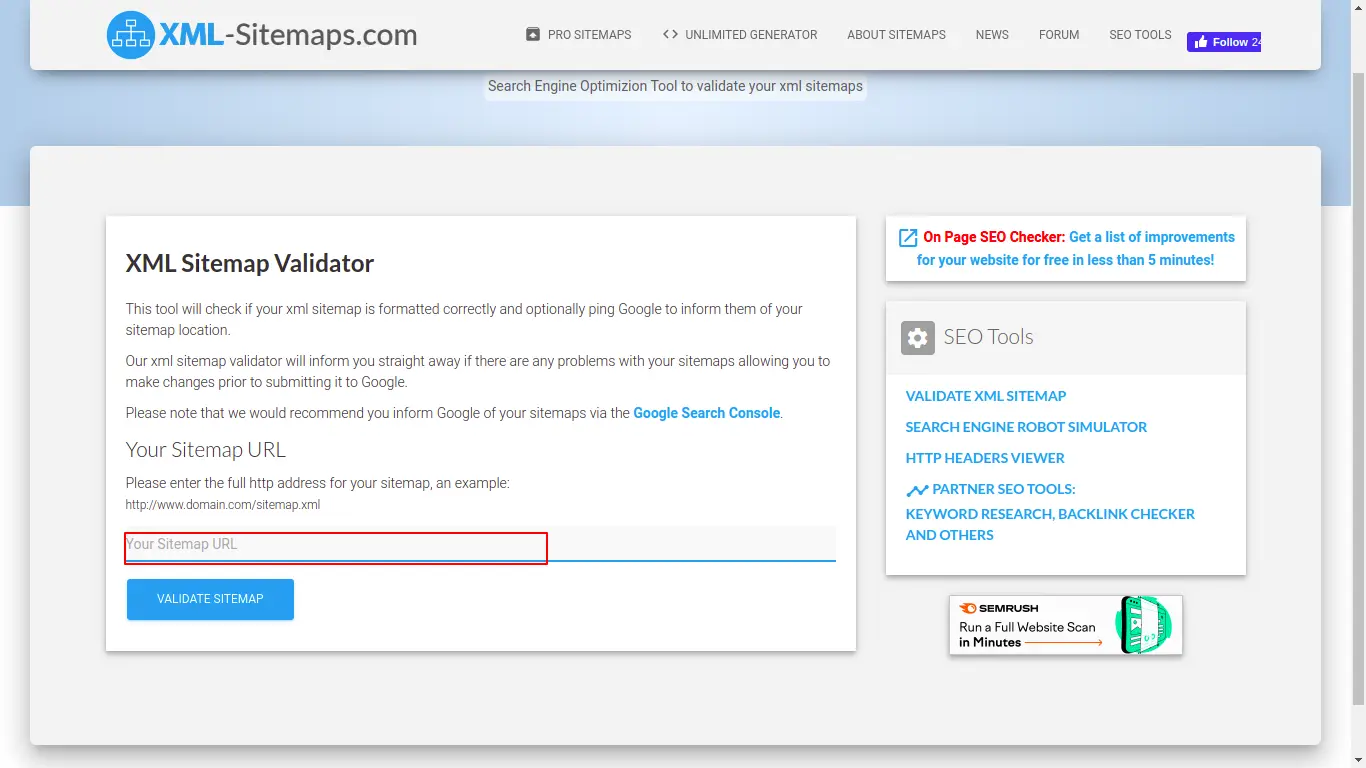
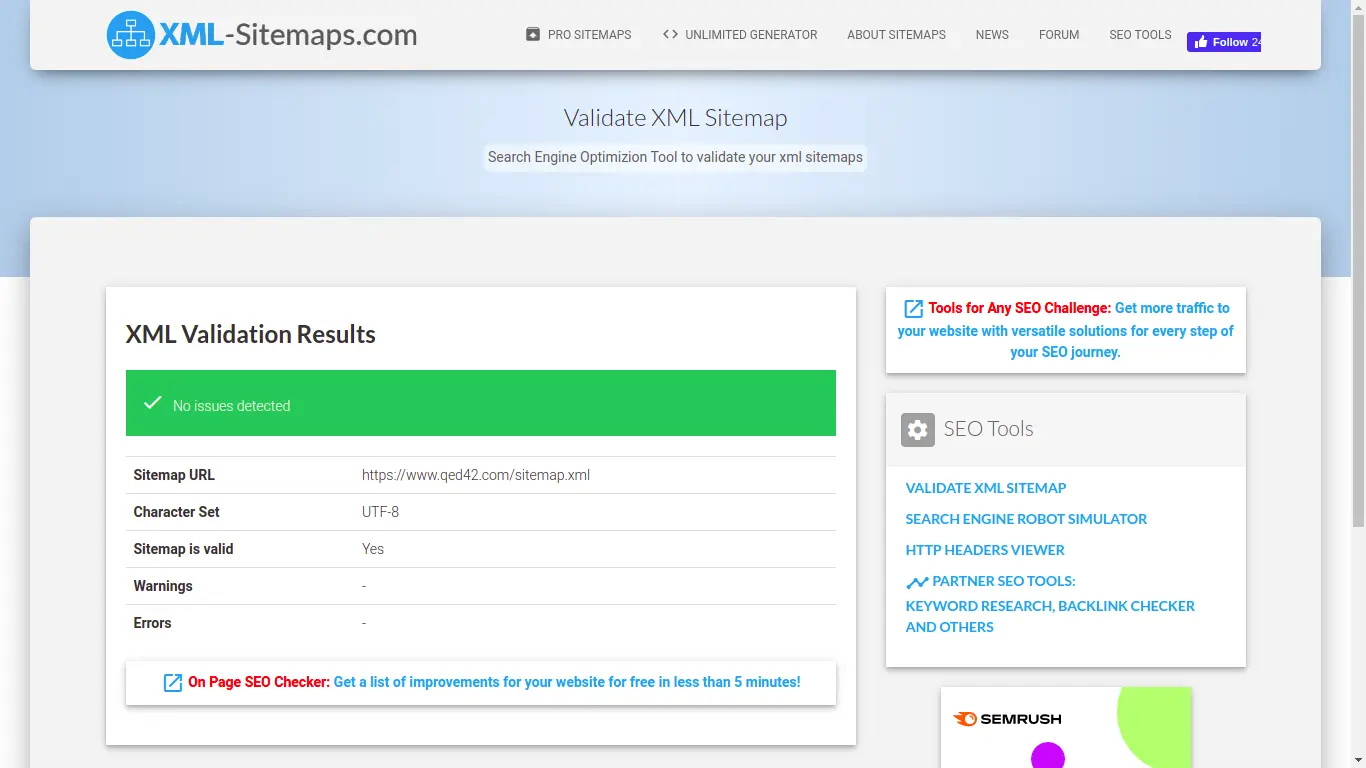
Note: There are paid tools available that can handle all of a website's SEO functionality.
SEOptimer
SEOptimer is a website that offers various SEO tools, including a sitemap checker. The Sitemap Checker tool can be used to validate and test the sitemap. It checks for errors, such as broken links, and provides a report on the status of each URL in the sitemap.
Some features of SEOptimer are:

- Validate the sitemap structure.
- Check if all URLs are accessible.
- Check for any duplicate URLs.
- Check for any broken links.
- Check for the correct format.
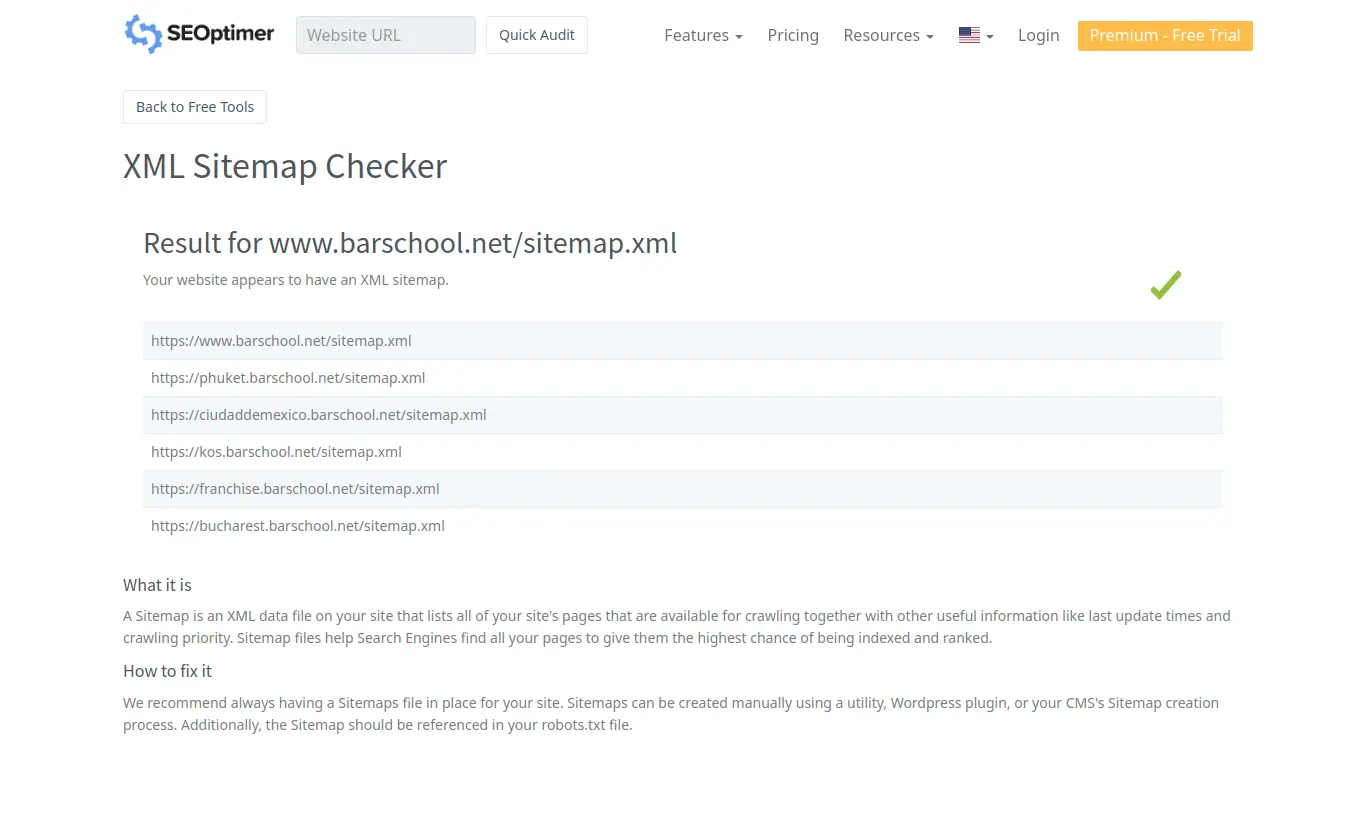
It's important to note that having a sitemap does not guarantee that all the pages on the site will be indexed, but it does help to ensure that the search engine knows all the pages on the site.
SEOptimer Sitemap Checker is a useful tool for identifying any issues and is a valuable resource for improving the website's SEO.
Real-time examples
Let's consider how to perform real-time sitemap testing using Screamingfrog, a popular SEO tool.
We will test a sitemap using Screaming Frog - European Bartender School.
- Open Screamingfrog and click on the "Sitemaps" tab.
- Click "Add" and enter the URL of the website.
- Add the sitemap and click "Start" to begin the crawl.
- Wait for the crawl to complete, and click on the "Sitemaps" tab again.
- We see a list of all the pages in the sitemap with their HTTP status codes and other information.
Here are two screenshots of Screamingfrog's sitemap testing feature.
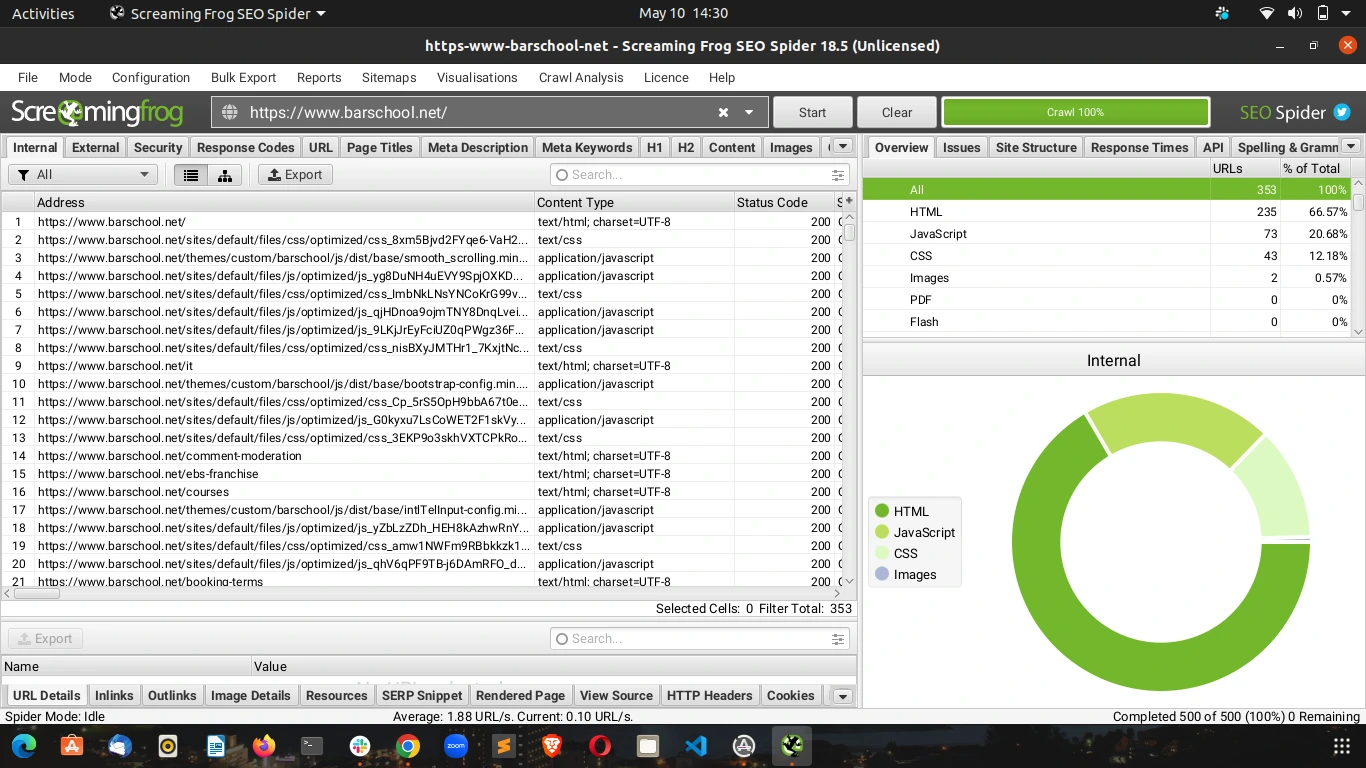
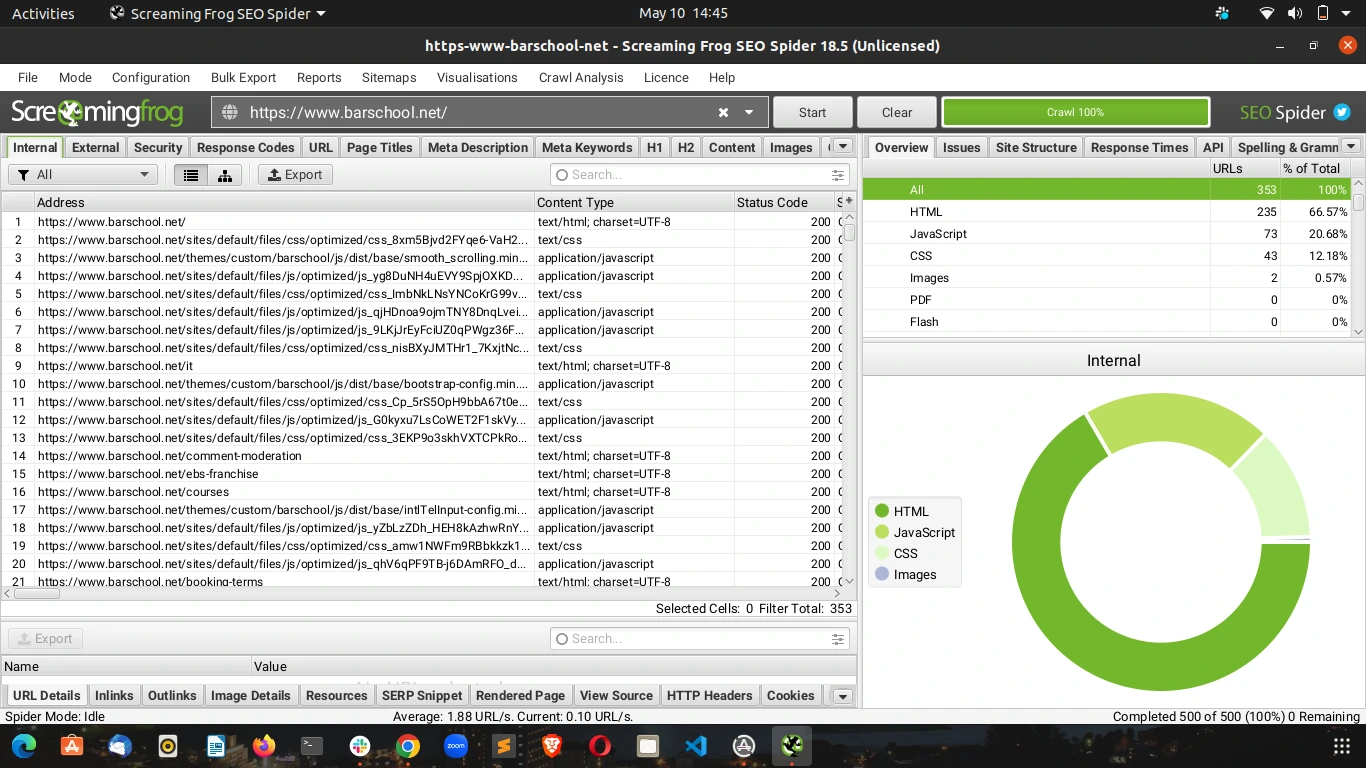
We will test another sitemap using Screamingfrog - Legal Aid DC. Below are some aspects that should be checked while testing using Screamingfrog.
- Check for broken links: Look for URLs that return a 404 HTTP status code. These are broken links and should be removed or fixed.
- Check for redirects: Look for any URLs that redirect to another page. Check whether the redirect is correct and the final URL is included in the sitemap.
- Check for duplicate content: Look for URLs with the same content as another page on the website. It can hurt the search engine rankings, so fix any duplicates.
- Check for missing pages: Look for any pages on the website not included in the sitemap and add them.
Here are some screenshots for the Legal Aid site using Screamingfrog.
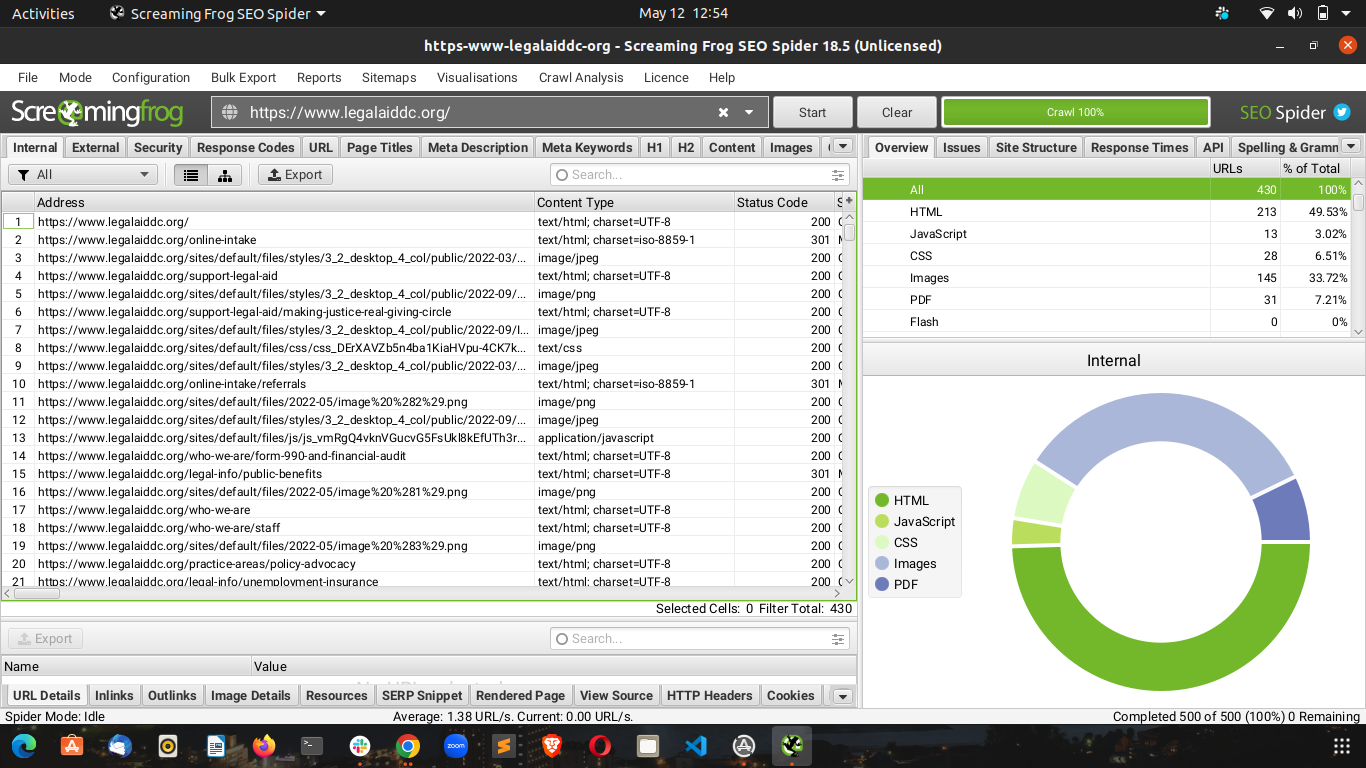
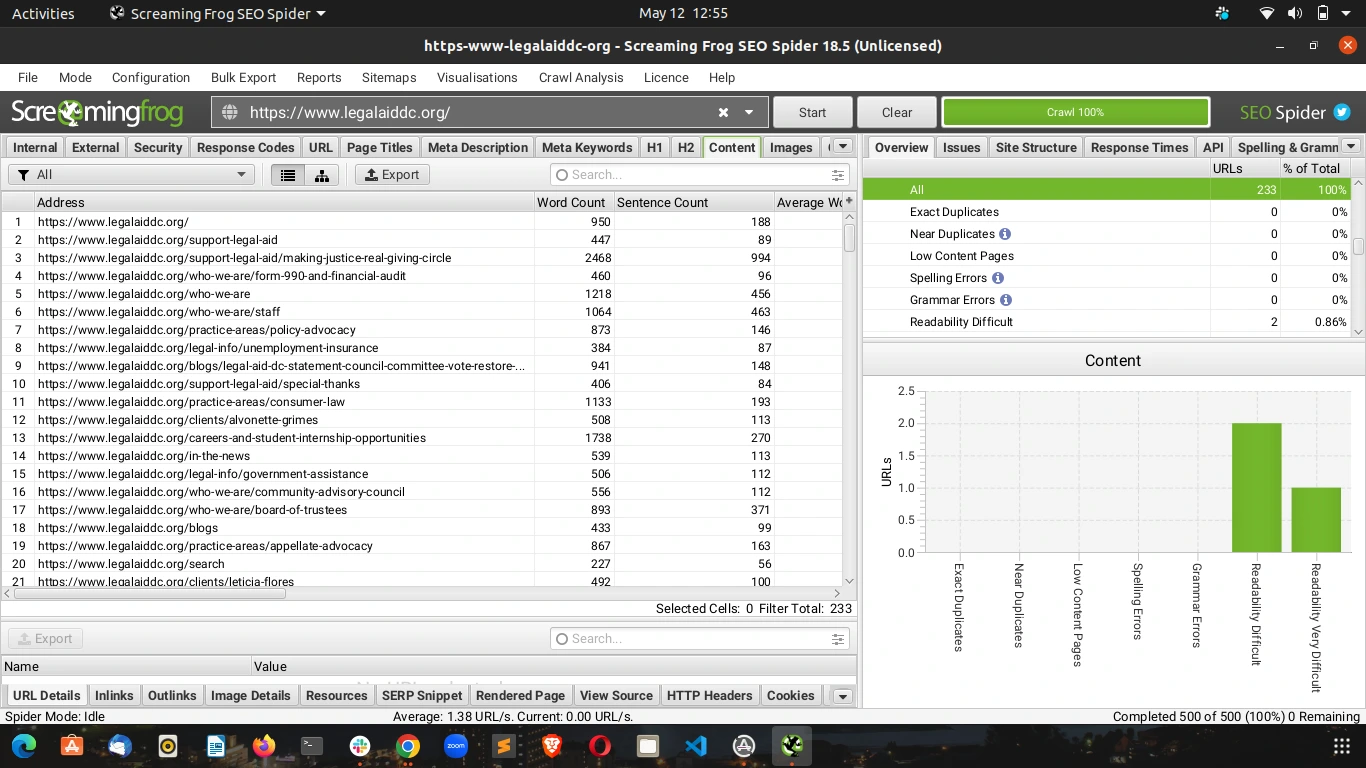
Conclusion
XML Sitemaps play a crucial role in ensuring that search engines can easily discover and understand the content on a website. When sitemaps are invalid, any new primary pages are crawled less efficiently, which can negatively impact a website's search engine rankings. It's therefore important to regularly check the sitemap to ensure that search engines can read it.
Sitemaps also serve as a canonical signal for Google's crawling and indexing system. This is particularly useful for larger websites with duplicate content, where stronger canonical signals like 301 redirects cannot be implemented. By including the canonical version of each page in the sitemap, search engines can better understand which version of the page is the preferred one.
In addition to their technical benefits, sitemaps improve the overall user experience (UX) of a website. By including all the pages on a website in the sitemap, visitors can more easily navigate the site and find the information they need. This can lead to increased engagement, longer session times, and ultimately, better conversions. Therefore, maintaining a well-structured and regularly updated sitemap not only benefits search engines but also contributes to a positive user journey on the website.

Testing React Components with Jest and React Testing Library
Testing is an essential part of building software applications. It helps to identify bugs, errors, and unexpected behavior before deploying the code into production. React is a popular JavaScript library for building user interfaces, and Jest is a testing framework that makes it easy to test React components.
In this blog, we will consider how we can test React components using Jest and some of its best practices.
Setting up Jest
To use Jest for testing React components, we need to install Jest with the below command:
For additional information related to Jest setup, refer Getting Started with Jest.
Starting with the unit tests
Before writing tests, let's look at the component we are testing.
Code Description
In the below code, we have a Search Input and are fetching the blogs from an API call and showing them in the UI. The App.js file contains a label, Search Input field, and useFetch hook, which we will use to fetch the content of the blog posts. The code is below:
We will be testing 3 things with this React component.
- Testing React component in the loading state
- Testing user interaction
- Testing for failed requests
Now let's look at how to write unit tests for the above App.js component.
Testing React component in a loading state
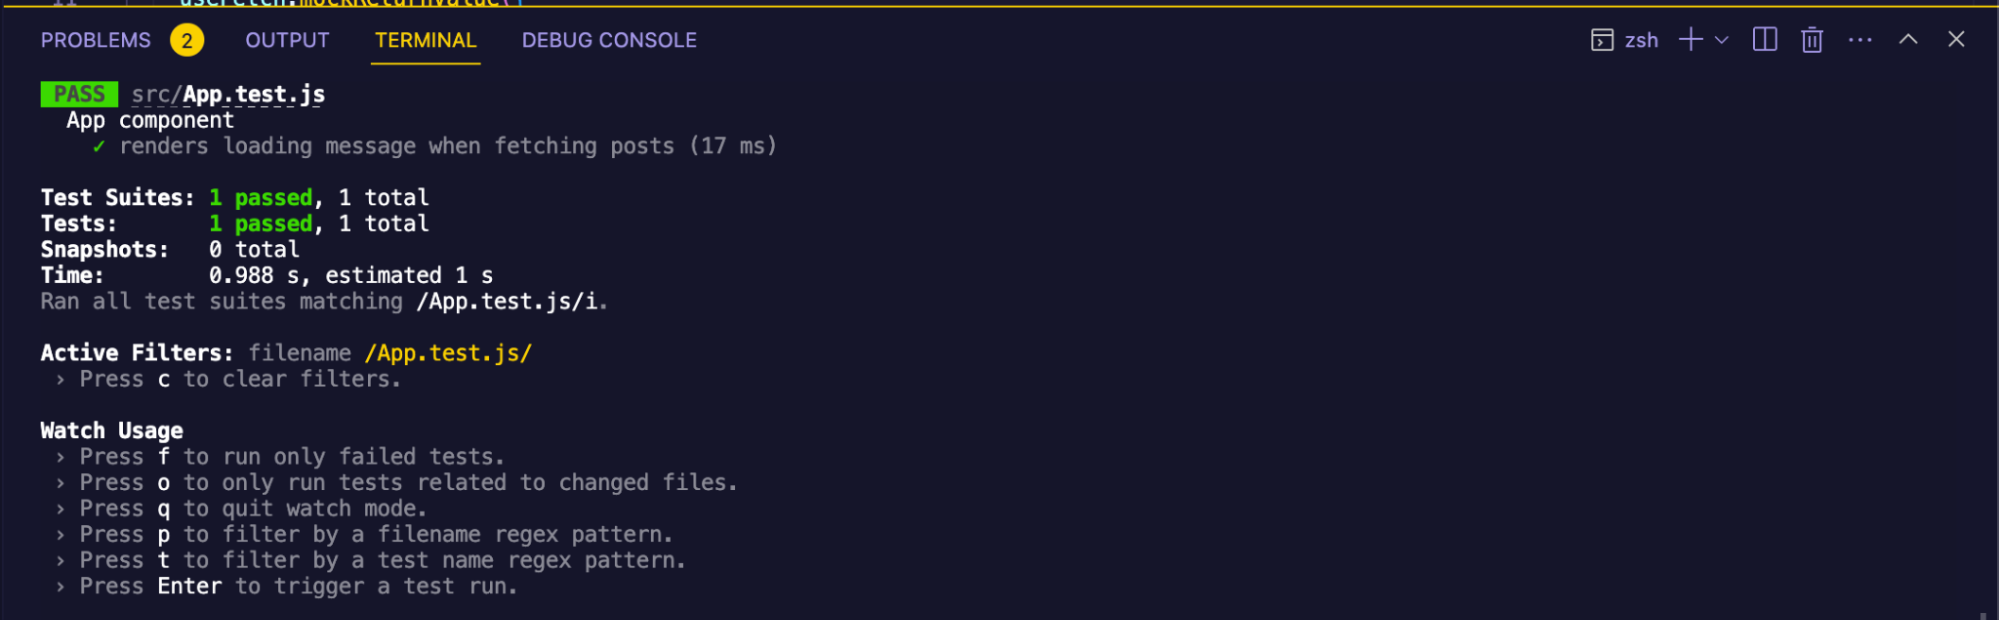
First, we will test for the loading state. We are mocking the return value from the 'useFetch' Hooks in the below code. Then we are rendering the App and expect to see the 'Loading Posts' text which will look like below.
You can run the tests with the command ```npm test -- App.test.js``` and see the results if it passes.
Test Results
Testing user interaction
To simulate user interaction, like clicking or typing, we will use fireEvent methods, and test the output.
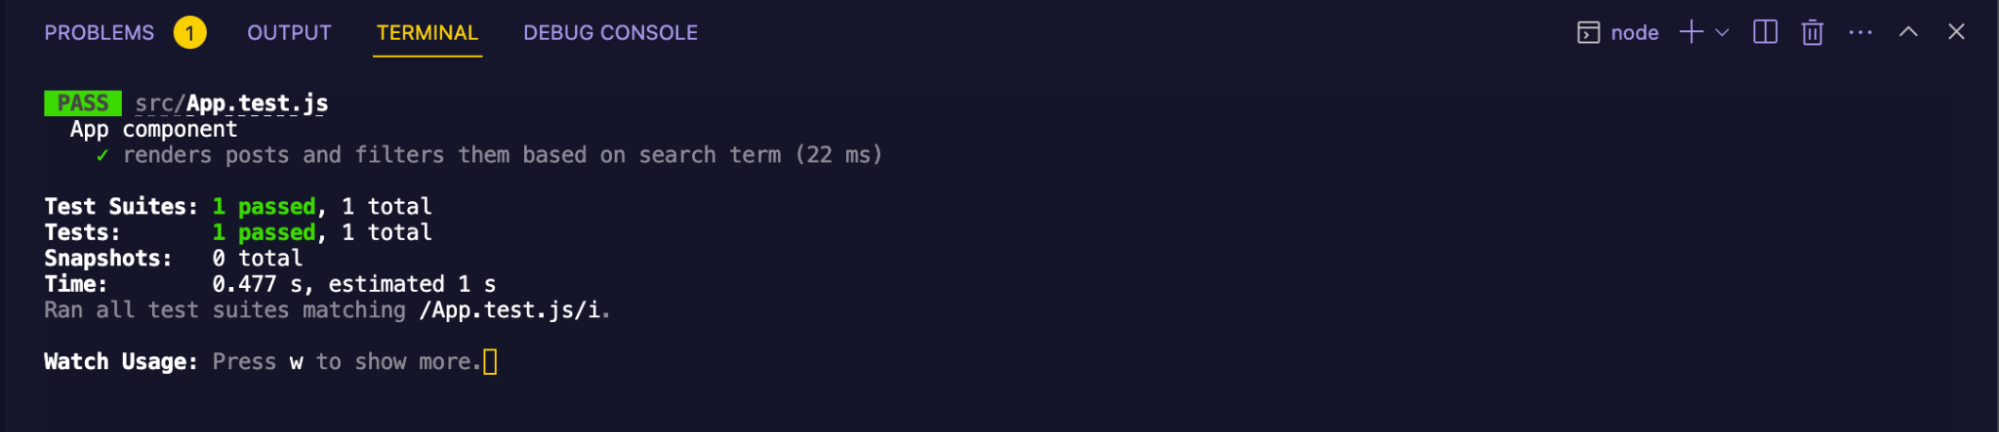
Here, we are testing the component by entering the text ‘second’ in the search field and validating that only the post related to it shows up.
Test Result
Testing for failed requests
We are testing a scenario when the API fails to fetch the posts. It will throw some error messages.
Test Results

Now the above-tested component is just one of the examples which we have shown in this blog. Let's consider multiple real-world scenarios that we can use, such as:
Login Page Testing
Let's say you have a login page for your application. You can use React Testing Library to simulate user input and test the login functionality. For example, you can use fireEvent.change to change the value of the email and password inputs and fireEvent.click to simulate the click of the login button. You can then use 'Expect' to verify that the correct action was taken, such as a redirect to the dashboard page or an error message if the login credentials were incorrect.
Shopping Cart Testing
If you have a shopping cart feature on your website, you can use React Testing Library to test the functionality of adding and removing items from the cart. You can simulate user actions, such as clicking on the "Add to Cart" button or removing an item from the cart, and then checking that the cart has been updated correctly. For example, you can use getByText to find the cart total and check that it is updated correctly.
Form Validation Testing
Another real-world scenario is testing form validation. You can use React Testing Library to simulate user input and verify that the form validation rules are working correctly. For example, you can simulate user input using fireEvent.change to change the value of a form input and then check that the correct error message is displayed if the input value is invalid. You can also verify that the form cannot be submitted when there are validation errors present.
API Request Testing
If your application makes API requests, you can use React Testing Library to simulate user input and verify that the correct data is displayed in the UI based on the mocked API responses.
These are just a few examples of applying Jest and React Testing Library to real-world scenarios. The possibilities are endless, and you can use these tools to test almost any aspect of your application. Let's look at some of the best practices.
Best practices
Use Snapshot Testing sparingly
Snapshot testing is a useful tool for detecting unexpected changes in your UI. However, relying too heavily on snapshot testing can lead to brittle tests that break easily. Instead, focus on testing the behavior of your components and use snapshot testing sparingly.
Use Mocks and Spies
Mocks and spies can help you isolate your components from their dependencies, making your tests more reliable. Jest provides a powerful mocking system to create mocks and spies for components.
Use Continuous Integration
Continuous integration (CI) means automatically building and testing your code whenever changes are made. CI can help catch errors early and ensure your tests always pass. In 2023, using a CI system is becoming increasingly common, and it's highly recommended to integrate it into your testing process.
Test the behavior, not the implementation
Instead of testing specific functions or components, focus on testing the behavior and functionality of your app. It makes tests more reliable and less likely to break when you make changes.
Keep tests simple and focused
Write small, focused tests that only test one thing at a time. It makes it easier to debug failures and maintain your tests over time.
Use beforeEach() and afterEach()
Use these functions to set up and clean up test data. It can help prevent test data from interfering with other tests.
Use waitFor() for asynchronous code
Use waitFor() to wait for asynchronous code to finish before continuing with your tests. It helps prevent false negatives and flaky tests.
Use screen object to access the DOM
Use the screen object from React Testing Library to access the DOM elements rendered by your components. It provides a more reliable way to test your components than testing implementation details.
Use fireEvent to simulate user actions
Use fireEvent to simulate user actions, such as clicking or typing. It makes it easy to test the behavior of your components in response to user interactions.
Keep your tests up to date
As you make changes to your app, make sure to update your tests accordingly. It helps ensure that your tests remain accurate and reliable over time.
Summing Up
Testing React components using Jest and React Testing Library are essential to building high-quality software applications. We have discussed how to set up Jest and write some tests to check the rendering, user interactions, failed API requests, and behavior of a React component. These tools can help us write comprehensive tests for React components and ensure they work as expected.
.avif "DrupalCon Pittsburgh 2023: The Future of Drupal!")
DrupalCon Pittsburgh 2023: The Future of Drupal!
Stepping back into the Drupal world this year at the DrupalCon Pittsburgh in person was an incredible experience. More than 1500 came together to innovate, collaborate, and celebrate. It was wonderful to immerse ourselves in the vibrant Drupal community, and we are eager to share our firsthand account of the conference.
The unwavering spirit of the community is what sets Drupal apart. We witnessed the power of a thriving environment where passion, knowledge, and ideas fuel Drupal’s growth and reinforce its prowess as an open-source management platform.
We attended a few enlightening BOFs, presentations, and initiatives that left us inspired and confident about the future of Drupal. The Drupal Association has published all sessions on its YouTube channel so that no vital information is missed.
Here are some important highlights from DrupalCon Pittsburgh, and our take on them.
DriesNote: The state of Drupal!
DriesNote highlighted innovation and progress with the motto - Innovate or be left behind! He emphasized the importance of prioritizing and supporting product innovation. He spoke about innovation S-curves, where initially it is a slow progress followed by rapid innovations and stagnation, and then a leap to the next curve.
He explained how Drupal has been jumping S-curves over the years by having a strong vision and purpose, a supportive environment, and the time for ideas to flourish.

He encouraged the Drupal community to embrace transformative changes and create an environment to support and nurture organic experiments. Calling it "Letting 1000 Flowers Bloom", he stressed the need to foster grassroots ideas and ongoing innovation.
Following this, Dries introduced the Drupal Pitch-Burgh innovation contest, which invited the community to pitch innovative ideas and funding requests. Out of the 7 finalists, 5 won the contest, and more than $100,000 (a combination of initial funding and spontaneous crowdfunding) was raised to fund remarkable proposals.
Keynotes, sessions, and lightning talks
Building a community of practice for digital standards compliance
Joyce Peralta spoke about how McGill University revised its digital standards in 2019 by compiling its web policies and best practices in an organized and concise document that now serves as the governance framework for the university. She spoke on how building a community of practice for digital standards compliance can govern and guide web practices and cross-departmental collaborations in the higher education landscape.
1000 battles, 1000 victories
Kevin Paxman's lightning talk on how the University of Waterloo moved 1000+ sites out of Drupal 7 to the current Drupal version was inspiring. He discussed the challenges of moving to the cloud and finding replacements for contrib modules that work differently or are not updated in modern Drupal. He explained how modern Drupal is more flexible and empowers users to create content without compromising visual standards or accessibility.
Leveraging AI in Drupal 10 with OpenAI and ChatGPT
Kevin Quillen spoke on the hot topic of this year – OpenAI and ChatGPT! He explained how integrating OpenAI in Drupal can revolutionize content creation and user experiences. A demo played at the session showed how ChatGPT can help compose an idea for a page of content in CKEditor5 quickly with simple steps and prompts. The module is available and usable in Drupal 10. OpenAI and Drupal result in powerful tools that accelerate content creation and management.
Highlights of DrupalCon Pittsburgh
Drupal 7 EOL
Drupal 7 official end-of-life is scheduled on Jan 5, 2025. There will be no further extensions and no vendor support after EOL. The Drupal Association is also working to certify migration partners (partners and contributors) to help D7 users migrate.

Drupal 10.1.0
Though a minor release, Drupal 10.1.0, scheduled to release on June 21, 2023, comes filled with new features and innovations.

Community Summit
The "Organize Locally, Contribute Globally" summit showcased various efforts to encourage contribution, such as creating an Events Platform for organizers to build websites and the Contribution Credit System to recognize the work of organizers, sponsors, speakers, and volunteers.
We look forward to nurturing the local Drupal community in our next Drupal Camp this year in Pune, India. Submissions for session proposals are open until 25 June 2023.

Project Browser Initiatives
Project Browser is on the Beta 4 version, and the initiative is working towards getting an MVP. The team is working on UI for Drupal 11, which would be a significant change for user experiences. While Chris Wells and Leslie Glynn have implemented a basic UX for the PB initiative, our QED42 team members are working on a UX audit for the same.

Drupal: Building tomorrow, today!
DrupalCon Pittsburgh was an exciting event where the community came together to create something unique. The atmosphere was filled with innovation, synergy, and inspiration.
We are proud to be a part of Drupal’s success. Seeing how it has grown and its impact on the digital world is truly inspiring, and this event reminded us why Drupal is a driving force in the industry.

The community's energy reignited our sense of Drupal’s purpose - “Nobody can stop anyone from using Drupal (Non- Exclusive), and one person using Drupal won’t prevent someone else from using Drupal (Non-Rivalrous).”
We all shared a vision of embracing change, pushing boundaries, and shaping the digital landscape for the better. The conference left us feeling motivated and ready to take on any challenges.
The connections we made, the knowledge we gained, and the inspiration we received will guide us toward a brighter digital future. Together, we have the power to make a lasting impact, and we at QED42 are thrilled to continue on this wonderful journey.

CKEditor 4 vs. CKEditor 5: Behat Testing Techniques
Drupal, a powerful and adaptable Content Management System (CMS), enables users to create and maintain complicated websites effortlessly. It is an open-source platform with numerous modules and themes, empowering developers to build specialized and feature-rich websites.
The CKEditor, a well-known and frequently used WYSIWYG editor, is one of the fundamental parts of Drupal. By offering a user-friendly interface with formatting options, image insertion, link creation, and other rich text editing capabilities, Drupal CKEditor improves the experience of editing material.
Drupal users can make their websites more engaging and visually pleasing by generating and editing content with the CKEditor. As Drupal versions are upgraded, CKEditor is also updated. The latest version released with Drupal 10 is CKEditor 5. In this blog, we will discuss Behat test techniques for both CKEditor 4 and CKEditor 5.
CKEditor 4 vs. CKEditor 5
In Drupal, the "CKEditor" module is responsible for integrating the CKEditor WYSIWYG (What You See Is What You Get) editor into Drupal's content creation interface. CKEditor allows users to create rich, formatted text content without requiring knowledge of HTML or CSS.
CKEditor 4 is built on a monolithic architecture, meaning that all of its features and functionality are contained in a single JavaScript file. It uses DOM manipulation techniques to perform editing actions and provides a rich set of plugins and features that can be used to extend its functionality.
On the other hand, CKEditor 5 has a flexible design that allows you to add or remove features as needed. It uses a system called virtual DOM to speed up editing and works well with modern web technologies like React and Angular. Its modern and user-friendly interface is more accessible than CKEditor 4, streamlining the editing experience.
Moving from CKEditor 4 to CKEditor 5 might require changes to the DOM structure. However, it's worth considering that CKEditor5 has a newer and more adaptable DOM structure, designed to be more versatile and provide a seamless editing experience for developers and end-users. This allows for greater control over the final product.
Automate Behat test for CKEditor 4
CKEditor 4 and CKEditor 5 have significant differences in their DOM structures, which can impact Behat automation. Here's an explanation with an example:
CKEditor 4
The DOM structure in CKEditor 4 is relatively simple, and each text area is represented as a single iframe element. To enter text into the editor using Behat, you can simply locate the iframe element and send keys to it.
Example Behat test step
Behat custom context for CKEditor 4
This works great with CKEditor 4. But when we try the above custom context for CKEditor 5 we get the following error.

Why do we get this error
In CKEditor 5 it is not represented as a single iframe element. Instead the editor is composed of multiple div elements each with its own set of classes and attributes. To enter text into the editor using Behat you must locate the appropriate div element with ck-editor__editable class and use that to locate the specific editor instance and send keys to it.

Path to resolution
To address the error mentioned above it is necessary to create a separate Behat custom context that is specifically designed for CKEditor 5.
The function uses JavaScript to interact with the CKEditor instance on the page. It constructs a CSS selector to locate the CKEditor field based on the machine name of the field (i.e. label parameter) then retrieves the CKEditor instance using
Finally it sets the data value of the CKEditor instance using editorInstance.setData(""$string"");
Example Behat test step
Behat custom context for CKEditor5
The code is available on Github.
Conclusion
CKEditor is a feature-rich WYSIWYG editor that offers an intuitive interface and powerful functionality for content creators from beginners to experienced professionals.
It helps users create beautiful and sophisticated content with ease without requiring proficiency in HTML or CSS. This versatile tool offers a range of customization options making it the perfect choice for anyone looking to create professional-grade content.
When working with Behat/Mink remember to have a separate custom context for CKEditor 5 as it requires different scripting than CKEditor 4. The custom context provided in this blog demonstrates how to achieve it with CKEditor 5 in Behat/Mink.

Introduction to Google Tag Manager (GTM)
Google Tag Manager (GTM) is a free and open-source service that allows users to monitor, measure, and optimize the performance of their web pages. It was introduced on the Adwords platform in 2011 and has grown to become the most used tag management system over the internet. Google Tag Manager is a tool that allows you to install, manage and update code on your website. Each tag is called a “Google Tag”, which can profile visitors and track events as they happen.
What are Google tags
Google tags are invisible HTML/JavaScript/CSS codes embedded in websites for tracking, reporting, and analytics without installing any dedicated client. A web address identifies the Google tags appearing on web pages optimized for Googlebot, the search engine's user agent. All the tracking attributes, such as page views, time spent on site, and user engagement, are available in website analytics reports.
Main components of GTM
Tags
A GTM Tag is a snippet of code. Code snippets come from external sources that integrate tools, support, platforms, and other support with the website. GTM has preset configurations for all platforms like Google AdWords, Google Analytics, etc.
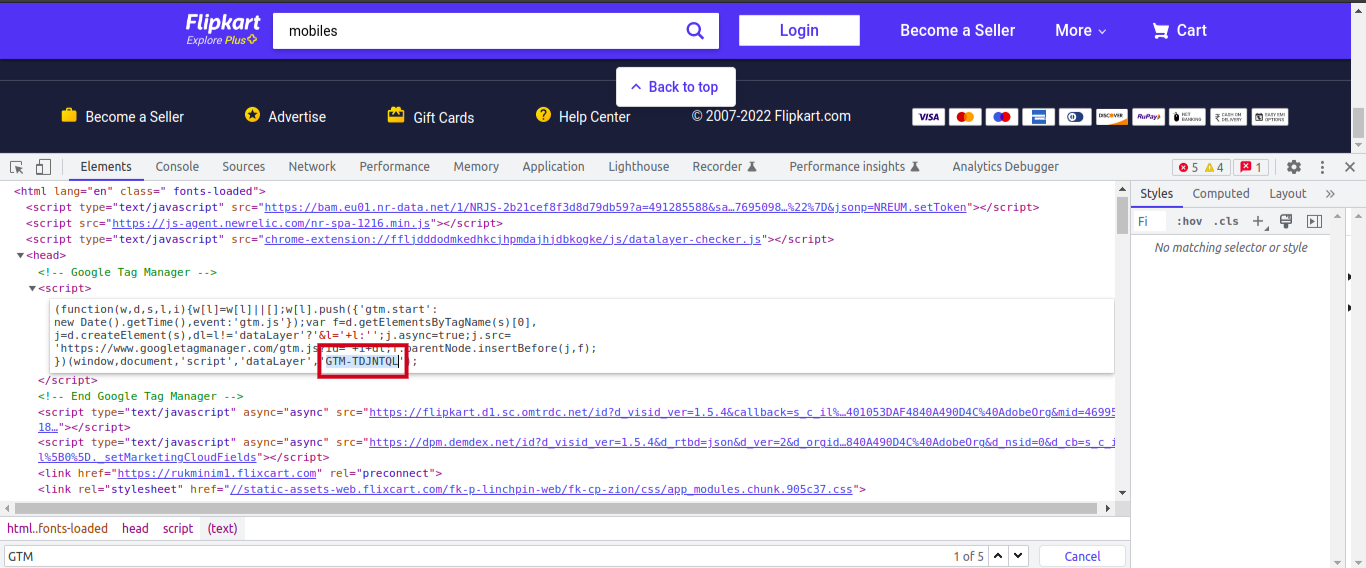
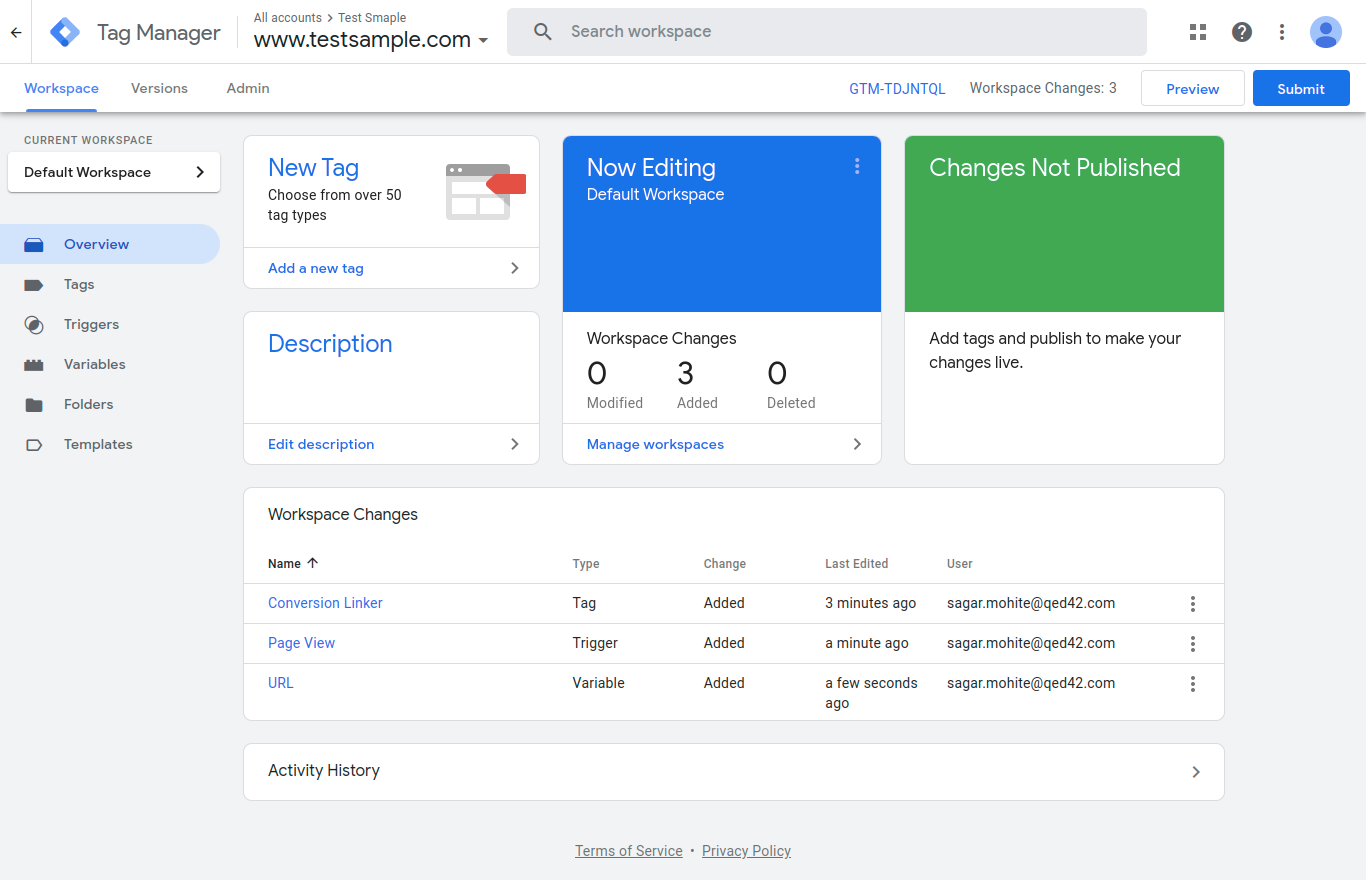
How to find a GTM tag
Go to “Tag Manager”, click on “Workspace”, and click on “Near the top of the window”.
For example - “GTM-XXXXXX.”
Triggers
It is a specific action that enables the tags to FIRE or collect the appropriate data and send it to the appropriate location. A trigger is nothing but an action performed on different Tags. Examples of common triggers include clicks, form fills, or page views.
Variables
It provides specific information about the action of a tag. GTM variables have two types:
Built-in variables: These variables are pre-configured by GTM. Some common variables in this category include Click Text, Form Classes, and Page URLs.
User-defined variables: The end-users have to manually set up these variables. A user-defined GA Settings variable sends data to a specific Google Analytics account.
Common variables of GTM
- Data Layer Variable
- Auto-Event Variable
- Constant Variable
- Google Analytics Settings Variables
- Refer URL Variables
Common tags of GTM
- Google Analytics.
- Google Ad-Words.
- Facebook Tracking Tools.
- Heatmap tracking code.
- Custom HTML scripts.
Google Analytics
Google Analytics is a platform and web analytics service that tracks and collects data from applications or websites and generates reports.
Types of Google Analytics
Universal
Interest
- The page visited by the user.
- The product searched by the user.
Interaction
- The action taken by the user.
- The info on the page searched by the user.
Conversion
- The process of checking product -add to cart- purchase.
Drawbacks
- We can track data either on the web or mobile at a time. We cannot track data for both simultaneously.
Universal mainly focuses on the total number of user traffic in most of the reports. To overcome this, we use GA4.
GA4
- GA4 is an updated version of Universal.
- We can track data simultaneously for web and mobile with GA4.
- Universal mainly focuses on the total number of users in most reports, whereas GA4 shows the active traffic in most reports.
- GA4 includes automatic tracking of all activity done by the user, including Scrolling, Clicking, and Videos Watched.
Commonly used plugins for testing
Data Layer Checker
We can check and track all activity from the current page. We don't need GTM ID to track all data in the Data Layer Checker. For example, from the checkout page to the purchase page.
Steps to use Data Layer Checker for testing
- Install Data Layer Checker (Chrome Extension)
- Open Website
- Click on Data Layer Checker
- Check Result
What to check in Data Layer Checker
It depends on the requirements of data tracking. We can track all activity on any website; Clicking, Sorting, Scrolling, & Applying Filters. In Data Layer Checker, events are tracked automatically.
Common data check-in
- Language
- Country
- Site name
- Page Name
Common data check-in list after login
- Email ID
- Phone No
- Cust. Type - New/Old
- User Name
- User Type [Logged In User]
Example
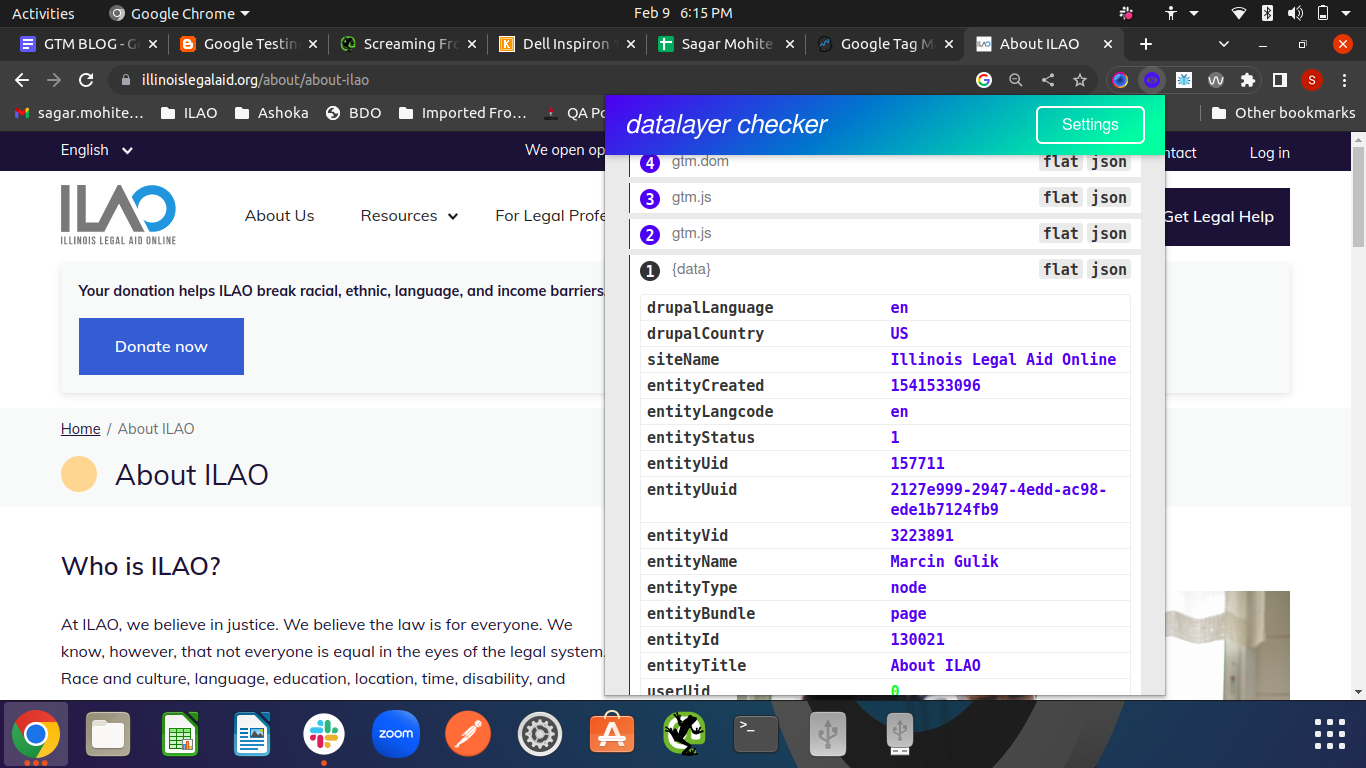
If you have a button on your site, that when clicked, should send an event to the Data Layer Checker with the category "About Us" and the action "Click". To test this, follow these steps:
- Open the ILAO site in a browser.
- Click on the Data Layer Checker icon in the browser's extensions to open it.
- Click on the Data Layer extension to start checking.
- Click on the Donate Now button, which will send the event to Data Layer Checker.
- Check the Data Layer Checker for a message indicating that the event was sent with the category "About Us" and the action "Click".
- Verify that the event was recorded by checking the Real-Time reports in Data Layer Checker.
You should see the event in the "Events" section with the category "About Us" and the action "Click".
Drawbacks
- If we redirect to another page then we can not track that activity.
- Data Layer Checker is time-consuming.
To overcome this we use GTM/GA Debugger.
GTM/GA Debugger
To check using GTM/GA Debugger we need a GTM ID and JS code to track all data. Using GTM/GA Debugger we can track all types of data like the current page, previous page, and all actions.
Steps to check GTM ID
- Inspect Page-> CTRL + F-> GTM.
For example- “GTM-TDJNTQL.”
Steps to use GTM/GA Debugger for testing
- Install Analytics Debugger (Chrome Extension)
- Open Website
- Open DevTool [ctrl+shift+c]
- Click on Analytics Debugger
- Start Debugging
- Check Result
Things to check in GTM/GA Debugger
It depends on the debugging tracking requirements. We can track all activity on any website; Clicking, Sorting, Scrolling, & Applying Filters. Events are tracked automatically in Data Layer Checker, and we have to check all events in the GTM/GA Tab.
Common data check-in GTM/GA Debugger
Add any product to the cart to see a list of results.
Checkout Page [Event generated for every action]
- Cart Amount
- Name [Product name]
- Price [Product price]
- Discount Percentage [Product discount percentage]
- Brand [Product brand]
- Category [Product category]
- Variant [Size/Year]
- Quantity
Example
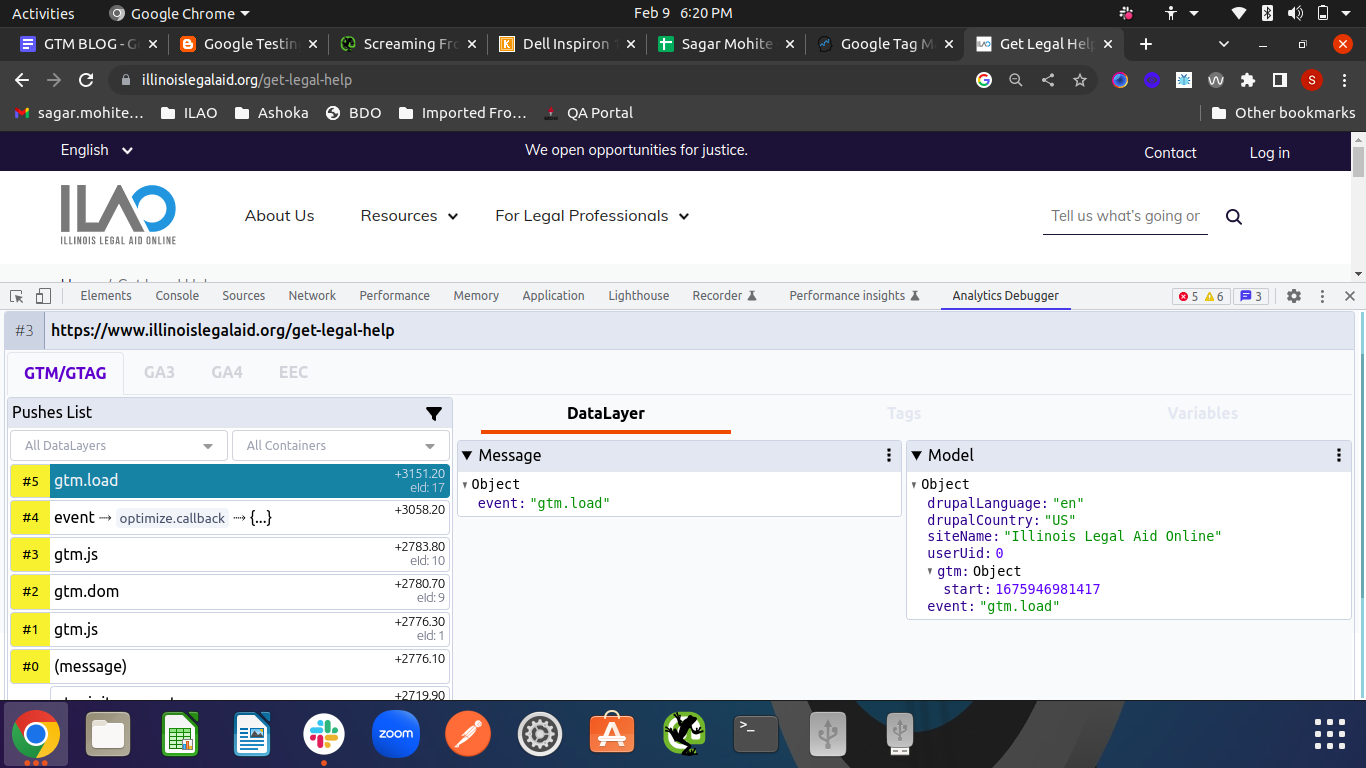
Let's say you have a button on your site that, when clicked, should send an event to GA with the category "Get Legal Help" and the action "Click". To test this, follow these steps:
- Open the www.ilao.com site in a browser.
- Open GTM by clicking the GTM icon in the browser's toolbar.
- Start debugging by clicking the Debug button in GTM.
- Click the button that should send the event to GA.
- Check the GA Debugger console for a message indicating that the event was sent with the category "Get Legal Help" and the action "Click".
- Verify that the event was recorded by checking the Real-Time reports in GA.
You should see the event in the "Events" section with the category "Get Legal Help" and the action "Click".
Drawbacks
- Without GTM ID, we can not track any data in GTM/GA Debugger.
- Sometimes we can't track data even with a GTM ID due to code issues.
Summing up
Google Tag Manager is a powerful tool for managing website tags and tracking data without modifying the website code. With GTM, you can easily set up tracking for various marketing and analytics tools, create custom tags, and manage all your website tags in one place. It saves time and resources and helps understand your website visitors' behavior better to optimize your website accordingly.

How to Test HTTPS and HTTPS Redirect
HTTPS stands for Hypertext Transfer Protocol security. This protocol ensures the secure transfer of encrypted HTTP data over a protected connection. You can validate website authentication and maintain data integrity by using secure connections, such as Transport layer security or secure sockets layer.
Checklist for HTTPS

HTTPS is a security protocol that encrypts data transferred via HTTP. Securing the transfer of data over the internet between computers and servers involves using an encryption algorithm to scramble the data, rendering it unreadable and inaccessible to anyone without proper authorization.
To protect your personal data, it's important to ensure that your online communication with a website is secure before sharing any information.
Two ways to check for secure sources
Look at the uniform resource locator (URL) of the website

HTTPS is the recommended protocol for secure URLs, rather than HTTP. The “s” in “HTTPS” stands for secure, which indicates that the site is using a secure ‘secure socket layer (SSL)’ certificate.
Look for a lock icon near your browser’s location field

The presence of the lock symbol and HTTPS in the URL indicates that the connection between your browser and the web server is secure and encrypted.
HTTP to HTTPS migration checklist
- Verify that the SSL installation was successful.
- Make sure HTTP Requests are being transferred to HTTPS.
- Make sure all your requests are using HTTPS.
- Make sure all versions of your website are added to the Google search console.

Note: To enhance the monitoring and optimization of your website, it's recommended that you add all potential versions, such as subdomains, to your Google search console. When adding properties to the search console, it is important to include “https://”if your website is served from an HTTPS protocol, as per Google’s recommendation.
- Your old HTTP links will be updated with HTTPS in Google index.
- The traffic to the HTTP version of your website will drop with time.
- You will see an increase in HTTPS traffic in your Google search console.
- Don’t forget to change to HTTPS in Google analytics.
- Make sure your new sitemap supports HTTPS and submit it to the Google search console.
- Update all your social media bio section links to HTTPS.
- Use the Google search console fetch and render tool to verify that your site is being crawled fine.
How does an HTTP redirect work?
HTTP is a protocol that follows a request/response model. When a client, such as a web browser, sends a request to a server, the server returns a response. HTTP redirects come in two types, permanent and temporary. A permanent redirect (HTTP status code 301) indicates that a resource has moved to a new location permanently.
This type of redirect is recommended for all redirections, except those that point to a different path. For example, if you're restructuring or migrating a website from HTTP to HTTPS, a permanent redirect is the appropriate choice.
Below is an example of the QED42 homepage
- Open Google chrome and go to QED42.com.
- Right-click on the home page and select the Inspect option.
- Enable the Inspect feature and click on the network and all tabs.
- Go to the clear button and clear all the data..
- Copy the current URL and remove the URL again.
- Remove the ‘s’ from the HTTP in the web address and press enter.
- You can now see this in the network area, scroll up the name column and check the status.


Advantages of HTTPS
- HTTPS provides a secure connection between websites and users.
- HTTPS ensures the security and privacy of user data by encrypting data and protecting information from unauthorized access.
- HTTPS enables users to safely perform transactions, including banking and other sensitive information, without the risk of data hacks.
- The SSL technology in HTTPS protects data from third-party threats and hackers, helping to build trust with users and ensure a secure online experience.
Factors to consider with HTTPS
- Users need to purchase an SSL certificate.
- The website’s slow loading speed would likely be due to communication complexities.
- Users have to update all internal links.
Secure a website using Let’s Encrypt SSL on Ubuntu 20.04
Install Let's Encrypt
To install Let's Encrypt on Ubuntu, run the following command in your terminal:

Allow HTTPS through the firewall and configure to Apache2 virtual hosts
To enable Apache2 to pass through the firewall, use the commands below if you’re using Apache:

Obtain an SSL certificate
To obtain an SSL certificate, execute the command given below:

You can use this command to generate an SSL certificate for your preferred domain by following the prompts displayed.

Test the auto-renewal process
Automatic SSL certificate renewal is handled by Certbot, and you can test it by executing the following command:

You have the option to perform a dry run of the auto-renewal process using the command below:

Conclusion
Using HTTPS is not a choice anymore. Having a trusted site is crucial for both users and search engines. HTTPS provides a secure way to transmit data between your website and web browser or server, protecting sensitive information like customer and payment data from potential hackers. By implementing HTTPS, you can ensure that your site is safe and trusted by your visitors and search engines.

5 Steps to Conduct Effective Test Automation
Organizations are constantly determining ways to improve their business and development processes to produce better products. It means speeding up deployment strategies to withstand the ever-growing market competition. However, this requires faster technology to test these products quickly and release them to the end-users.
That is why automation testing has come to the forefront, transforming existing testing processes and speeding them up. The method reduces manual testing errors, helps detect bugs, and improves the testing efficiency of testing professionals.
As a result, it leads to better deployment rates, high-quality code, and product efficiency. Moreover, companies can save sufficient time, resources, and money generally spent on manual testing.
Nevertheless, successful test automation is only possible when companies follow a systematic approach. It includes choosing the correct testing framework and executing the right test cases.
Understanding and implementing core automation testing concepts is fundamental to developing such an approach, as it identifies clear objectives and establishes metrics for success.
Consider all the crucial steps to conduct test automation effectively.
Key elements of a test automation strategy
A systematic automation tactic will enhance the effectiveness of all involved test processes. Further, all professionals will be on the same page using a solid plan. Here are the essential steps to operate a test automation procedure successfully.
Focus on fixed achievable goals
Appropriate test automation planning and execution can enhance the ultimate software quality. So, companies and professionals must determine achievable targets. It is the first step in preparing the strategy that decides the course of other testing phases.
Besides, an automation feasibility analysis needs to be conducted here. It analyzes the test cases that can be automated according to certain factors like infrastructure, frameworks, and ROI.
- Time-consuming manual tests
- Repetitive scenarios like entering user details and logging out
- Batch processes and user interactions involving multiple inputs
The analysis also determines the scenarios that are not feasible for automation. The testers can gauge the time and effort needed to complete the testing.
Choose a right tool and framework
After understanding the desired testing outcomes, the way ahead is to determine the testing approach. For this, testers need to figure out the appropriate framework for the project. Make sure the tools and framework can support the testing needs of your application and are compatible with your technology stack. Choose a framework that can be easily maintained and scaled over time.
An Automation Testing Pyramid is beneficial to simplify the selection process. The technique helps professionals understand the essential tests and their order of execution relevant to the scenario.
Further, the pyramid can indicate the frequency of the tests and the best approaches to execute them. Testers can use the structure to understand the tests to run as per the scenario or use case.
For example, they can identify the test execution order while testing an application that accepts user input and offers an output.
Create effective test scripts
The next phase of the strategy will involve creating test scripts and test cases. Test scripts are programs written to test a specific functionality of an application. On the other hand, test cases are documents containing the expected outcomes, data values, and specified conditions for automation testing.
Develop automation test scripts that are clear, concise, and cover all the necessary test scenarios.
Write test scripts that are reusable, maintainable, and independent of each other. Create data-driven tests to test multiple scenarios with minimal code changes. Ensure the test scripts cover both positive and negative scenarios.
Execution
Run the scripts to test the application and analyze the results. Make sure the test environment is set up correctly, and the scripts are running without any errors.
Integrate the automation into the continuous integration (CI) pipeline to enable continuous testing. Analyze the test results and identify any defects or issues. Debug the scripts and update them as needed.
Maintenance
Regularly maintain the automation suite to ensure it is up-to-date with the latest application changes. Continuously improve the test automation effort by gathering feedback from the team and stakeholders and making necessary changes to the automation suite.
Automation maintenance activity includes:
- Enhancing the expectation handling and error logging mechanism.
- Making the framework more robust and scalable.
- Adding new functionalities in the framework to handle more use cases and test cases.
- Code refactoring.
Summing up
The automation testing market size might grow at 14.2% CAGR from 2021-26. So, it is clear that many organizations will opt for this testing technology in the future to improve their services. Following an automation testing strategy will be vital in implementing the processes effectively.
Conducting meetings and organizational discussions will be necessary before implementing the testing strategy. All steps and intricate details should be discussed among the involved professionals. Transparent communication might help executives understand and implement the techniques.
Moreover, senior professionals can also obtain feedback from testers to identify areas of improvement. Continuous monitoring and optimization of strategies can help acquire better ROI from automated testing.

Understanding Front-end and Back-end Validations in Drupal
Validations are used to check the accuracy, integrity, and structure of data before it is used for a company's services. If any user sends unacceptable data to any application, then the application will send validation messages either from the client side or the server side.
Understanding front-end validation
The frontend is nothing but what a user sees on the website/ application. Front-end testing validates that GUI elements are functioning as expected / as per the requirement.
Consider an example of a form where it checks whether input fields accept the right characters, or whether forms are being submitted only after the required fields are filled, or whether navigation is easy enough, or whether the page is loading fast enough.
Front-end validation scenario
Uploading a file validation (format)
Consider a form where the user has to add a file of only .gif, .png, .jpg, .jpeg formats. If the user adds any image/document other than this format, the form must throw an error message.

In this case, the client will send a validation error message. As this is a small validation, it will happen on the client side.

Uploading a file validation (size)
Consider another example of adding a file size of more than the given limit. It will show an error message that the file size should not be more than the given limit. This validation is also handled by the client side.

Filling signup form on Facebook validation
To see how the front-end validation of Facebook signup works, we need to inspect the element and switch to the network tab.
- Don’t enter any value in the fields of the signup form and verify whether it is throwing an error message.
- In the network tab, observe no request is getting hit. This means the error is coming from the client side.
- The error is getting thrown before the data is sent to the server side.

Understanding back-end validation
The backend is named because it does not run on the device (mobile/laptop) but on a remote server.
Back-end testing validates the database side of web applications or software. Consider an example of a form where it checks if an email ID input field is not accepting duplicate entries.
Suppose a user has already entered an email ID while submitting a form. When the same email ID is entered while submitting a new form, the user must get an error that the user with this email ID already exists.
Back-end validation scenarios
Credit card validation
Suppose we are on a payment gateway and we are asked to enter details of a credit/debit card. Now, when the user enters data in it and clicks on the ‘Submit’ button, we see a loading button, and after that the ‘Credit card is not valid' message. This means the system has checked from the backend if the credit card details are correct using APIs.

Existing email ID validation
Consider another example of a user details form, where the user enters the email address of an already registered user and clicks on the Continue button. An error message is displayed on the server side. The application checks if an email address is already present in the database, and if present, the user gets an error message that the email ID is already registered.

Google validation using an ID token
Let us explore another example of how we can create an account on apps like Spotify or LinkedIn by logging in with Google or Facebook.
If we open any website app and click on the Login button, we get an option to log in with Google/Facebook/Email for registering or creating a new account.

If we want to create a new account, we will click on the login button. Here we will get options to log in with Google/Facebook/Email button.
If you use Google Sign-In with an app or site that communicates with a backend server, you need to understand the below steps happening in the backend:
- The currently signed-in user on the server.
- After a user successfully signs in, the user's ID token is sent to your server using an HTTPS POST request for secure sign in. Then the user is validated.
- The integrity of the ID token is validated on the server and the user information contained in the token is used to establish a session or to create a new account.
An easy way to validate an ID token is to use the tokeninfo endpoint. This endpoint sends an additional network request that does most of the validation for you while you test proper validation. To validate an ID token using the tokeninfo endpoint, make an HTTPS POST or GET request to the endpoint, and pass your ID token in the id_token parameter.
For example, to validate the token "XYZ423", make the following GET request: https://oauth2.googleapis.com/tokeninfo?id_stoken=XYZ423.
If the token is properly signed, you will get an HTTP 200 response.
Restricted roles in Drupal
Suppose we create a role ‘Contributor’ in a CMS like Drupal and disable the permission to view the toolbar search option. We can validate it by following the steps below.
- Open the site URL and Login with Contributor role credentials.
- Verify the contributor is not able to view the admin toolbar search icon.
Understanding how they work
Let us consider online shopping websites like Myntra.
Things the user is seeing on the screen and interacting with like product lists, Added items in the cart, checkout screen, etc are part of the frontend. But, these things are not present on the user's machine(mobile/ laptop /desktop).
However, they are stored and managed on Myntra’s server side so that all the users will be able to see the same data on the applications/websites. Also, this data can be managed from the server side by adding/ deleting/ updating the details.
Also, whatever happens on the screen is controlled by the front-end code. Whatever the user sees, the frontend is responsible for showing and updating it.
Advantages of front-end validation
- Front-end validation is responsible for improving the user experience of using the application/website.
- Front-end validation determines the user can view, access, and interact with each element of the product easily.
Disadvantages of front-end validation
- Client-side validation can be bypassed easily.
- This validation does not assure that the application is protected from malicious attacks on the server and database.
Advantages of back-end validation
- Back-end validation confirms no corrupt data/invalid data is present in the database by eliminating the data errors.
- The submitted data is cleaner and more sensible.
Disadvantages of back-end validation
- Implementing the back-end validation code increases the response time resulting in poor user experience.
Summary
Because of both validations, we can have a good performant application with fewer errors. The validation also reduces the complaints and rejections against the requirements of the product.
To improve the quality of a website or application we need to validate both front-end and back-end methods of validation. Both validations are critical in terms of security.
I hope this has been helpful!! Happy learning!

Postman: Best Practices for API Testing
API stands for Application Programming Interface. It acts as an intermediary to communicate between two applications or electronic devices over the world wide web (www). API provides interoperability between different kinds of hardware and software platforms. API supports different HTTP methods like GET, POST, PUT, and DELETE in the browser.
There are several API testing tools available, such as POSTMAN, SOAP UI, JMeter, REST-Assured, Katalon Studio, etc, and QAs prefer to use the Postman tool over others.
Why opt for Postman?
- Free, open-source, and easy to install
- Easy to create Collection/Test suite
- Easy to create and maintain requests in the folder structure
- Facility to create multiple environments and maintain test data (Global and Local level)
- Easy to maintain execution order of requests
- Reusability of defined functions
- Easy to export and import collection
- Allows data-driven testing using .csv and .json file
- Easy to run remotely
- Allows integrating with CI tools like Jenkins using the Newman Command line tool
- Allows to collaborate and work with teams
- Supports all platforms
- Wide helping community present
Let’s get started with best practices
Suppose we want to test Google Map API. For this test, we need the below scenarios.
- Add Location in Google Map
- Update existing Google Maps location
- Get/Fetch location from Google Map
- Delete location from Google Map
Now consider best practices to test the above scenarios.
Understand application flow
As per the API specification document, QAs should first understand and analyze end-to-end the flow of the application and decide on the testing scope. Then, define the sequence of requests to be executed.
Consider the scenario where we need to add, view, edit, and delete operations on a Google map location. Then, as per requirement, we need to execute HTTP request methods in the below sequence:
- POST request: To create a new Google map location
- GET request: To fetch created Google map location data
- PUT request: To update/edit created Google map location data
- GET request: To check whether Google map location is updated or not
- DELETE request: To delete Google map location

Set up Postman environments
If we want to execute a created request on different test environments like QA, Dev, Stage, and Prod, we need to create those required environments in Postman. It will help to execute the above-created API requests in the required environment without changing test requests. It will reduce the testing efforts and number of requests.

Create collection to organise requests
Suppose we want to create a Test suite like Smoke, Sanity, and System test requests, then we can create folders under the collection as per suite and Organise the API requests by placing them in their respective folder. It helps to maintain the requests as shown below.

Define local level and global level variables
In the above example, when we send POST requests to create a Google map location, then in the API response, we get “place_id”. The same value we use in other HTTP requests like GET/PUT/DELETE requests to perform CRUD operations.
In that case, we should define the test data in global and local variables based on where they will be used. We can use these variables in the script, making it readable and understandable. Moreover, only when something changes we need to update it in one place to reflect in all tests.


Write tests for each request
For the above scenarios, we need to add requests, and under the Test tab, we need to write tests and validate the response (status code, response time). Run the tests and get the request pass/fail status.

Identify reusable functions
We should identify and list the reusable functions to reduce code repeatability and increase maintainability.

Add pre-request scripts and post request script
We can add pre-request and post-request scripts to be executed before and after each request for the above scenarios. It will help in better readability of the execution report and avoid duplication of requests.
Collection Level Pre-request Script:

These scripts will apply to all requests which are present under the collection.
Folder Level Pre-request Script:

These scripts will apply to all requests which are present under the folder.

This script will apply only to individual requests.
Define tests execution sequence
In the above example, we need to define the test execution sequence like Create Google map location (POST), Update Google map location (UPDATE), retrieve Google map location (GET), and delete Google Map location (DELETE). API sequencing will help to execute the API requests in the expected order. Users can test the end-to-end flow of the application in a single click using this feature.

Prepare test data
In the above example, suppose we want to perform data-driven testing for Create Google Map location API, then we can store test data in CSV or JSON files. And execute N-Number of time requests repeatedly. It's important to identify test data so that it covers positive and negative use cases, and stores them in their respective files.
Share workspace and collaborate
Multiple QA resources can work on the same collection by sharing a workspace, which helps in versioning control. In Postman, we can use the Share option available to allow other team members to collaborate.


Implement continuous integration
With the help of the Newman tool, we can execute exported collections on remote or local machines using a command-line interface. The command is the ‘newman run <collection name>’ command.
With CI tools like Jenkins, we can schedule, trigger, and execute the Postman collection every day, and check application health.
Wrapping up
Postman is the must-have tool for effective API testing for any project. By following the above steps, you can easily set up and implement API testing in your project. Additionally, combining manual with automated testing using the CI tool makes API testing more reliable and efficient.

Top Tips to Accelerate Automation Script
To automate features of an application, we create automation test scripts. An automated script is code that runs automatically based on a defined state, input, and expected output. While writing the test scripts, we need to identify the web elements on the UI.
For example, say you have added XPath or CSS property in the test script to identify the web elements. When you execute the script, it either results in multiple matches or fails to identify the correct input element. Then you may try with a different CSS property or XPath expression, but that may fail too. Re-execution of the test scripts and debugging the issue consumes a lot of time. We can save this time by validating the CSS selector or XPath expression before adding it to the code, making test scripts more reliable.
Tips with automation scripts
Browser developer tools allow you to inspect, test and debug codes. In this blog, we will use Chrome DevTools to create quick and reliable test scripts for automation!
Elements Panel
Open Element Panel
Press F12 to open up Chrome DevTool > Elements panel should open by default.
You can also right-click an element on the page and select Inspect to jump into the Elements panel. Or press Command+Option+C (Mac) or Control+Shift+C (Windows, Linux, ChromeOS)
Enable Search in the Element Panel
Press Ctrl+F to enable DOM search in the element panel.
Type XPATH or CSS to evaluate
Enter XPath expression or CSS selectors in the search box to identify web elements in the DOM. The provided expression or property will be evaluated, and matched elements, if any, will be highlighted in the DOM.
When multiple elements match, we can use customized XPath or CSS. Customized Xpath helps to create effective XPaths of the web elements and constructs a unique locator for the web elements. CSS Selector is one of the important locators in automation. We can create customized CSS using HTML attributes like ID, class name, and tag name combination.
Console Panel
Open Console Panel
Press F12 to open up Chrome DevTool > Switch to the Console panel.
You can also press Command+Option+J (Mac) or Control+Shift+J (Windows, Linux, ChromeOS) to jump straight into the Console panel.
Type XPATH or CSS to evaluate
Type in XPath expressions like $x(".//header") or CSS selectors like $$("header") to evaluate and validate. Once tokens are executed, check the results returned:
- When elements match, they will return as a list. Otherwise, an empty list [ ] is shown.
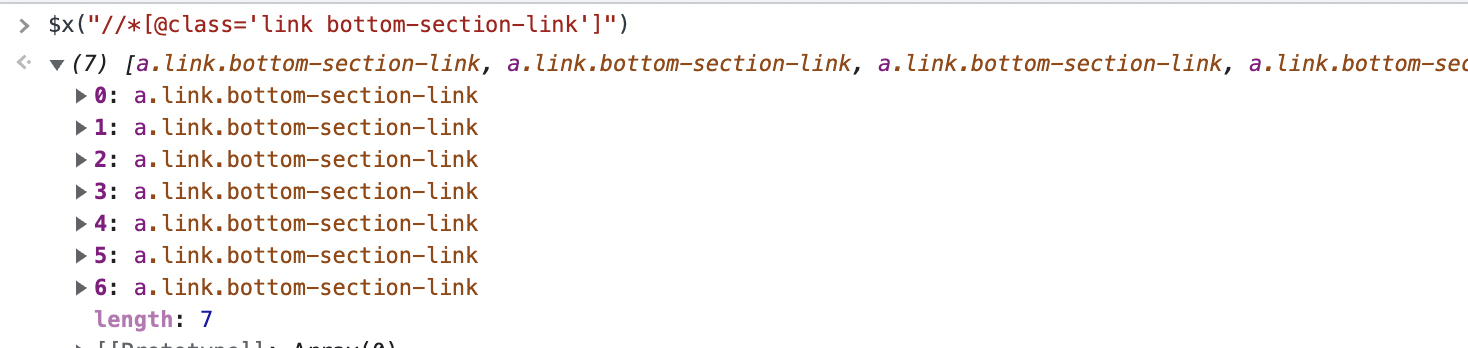
- When the XPath or CSS selector is invalid, an exception is shown in red text.


Important tip: From the console panel, use either the $('selector') or $$('selector') console commands to select element(s) from the DOM. $ uses the querySelector DOM method, which returns a single matching DOM element. $$ uses querySelectorAll, which returns an array of all matching elements.
How to build customized Xpath and CSS Selector locators based on HTML attributes
Xpath and CSS selector are the generic locators. To write automation test scripts, we can construct Xpath and CSS locators with any HTML element on the page. To create manual customized Xpath and CSS selectors, analyze the HTML properties and their values first.
How to create the customized XPath with the help of a unique attribute of the element?
Consider you need to identify the “From city” field on makemytrip.com using XPATH
We can use id -
Now, type the customized XPath in the console and validate whether it finds the correct element. The console will show the matching elements, and when we hover the cursor on the element, it will highlight the web element on the screen.
As you can see in the screenshot below, for the element “From city” > “Mumbai” city is getting highlighted correctly.
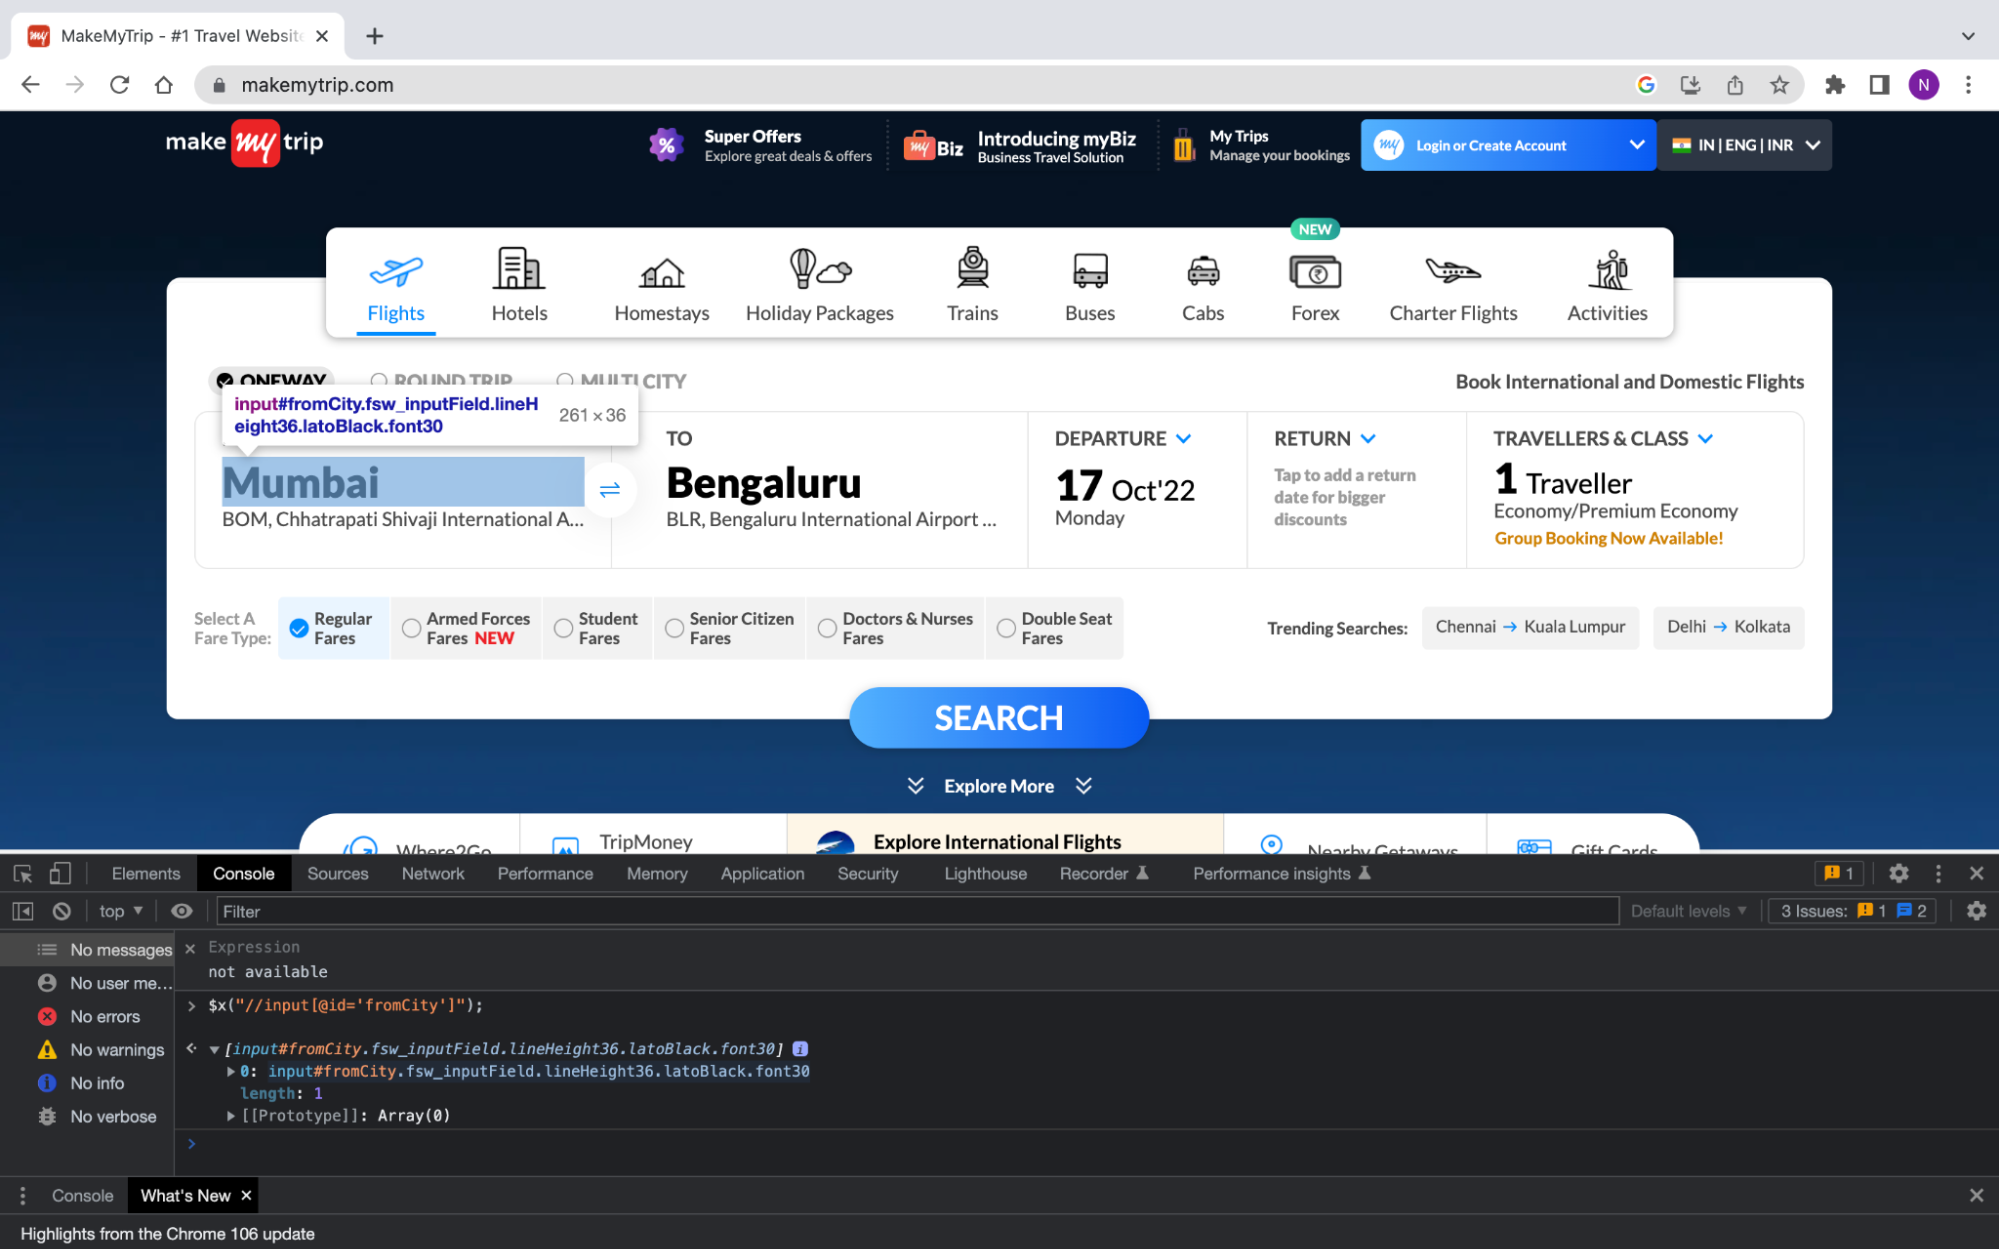
How to find accurate web elements by using customized XPath when we have multiple matches?
When we have multiple matches, we can handle it using an index in the XPath. Consider an example of selecting a “Property Type” field.
When we use the above XPath expression, it will start highlighting multiple elements because of common attributes of the class.
To identify the web element uniquely, we can call that element by using the index. For this test, we will write XPATH to uniquely locate the second element to perform tests and verify results.
Here [2] represents an index.
In the below screenshot, we can see that with the help of the index, we can locate the second element. The console window highlights this element on the screen.
How to handle web element index in CSS when we have multiple matching elements
In CSS, to handle indexing, we use “nth-child” to highlight or encounter the desired web element.
In the below screenshot, we use an index in the CSS selector to highlight the desired web element.
Note: In some cases, the index number may change for the Xpath and CSS because of some hidden attributes in the HTML code. In such cases, XPath will ignore that hidden attribute, while CSS will not.
Conclusion
In this article, we saw how developer tools help to speed up automation script writing. Customized XPath and CSS selector help identify and locate web elements uniquely on the webpage, improving the efficiency of automation tests. A QA automation engineer should follow these steps in their scripting writing process.
Happy Automation !!